For athletes, maximizing sports performance is the ultimate goal. Achieving peak performance involves a combination of dedication, discipline, and employing intelligent training methods.
One crucial aspect of training that often gets overlooked is understanding and harnessing your training zones.
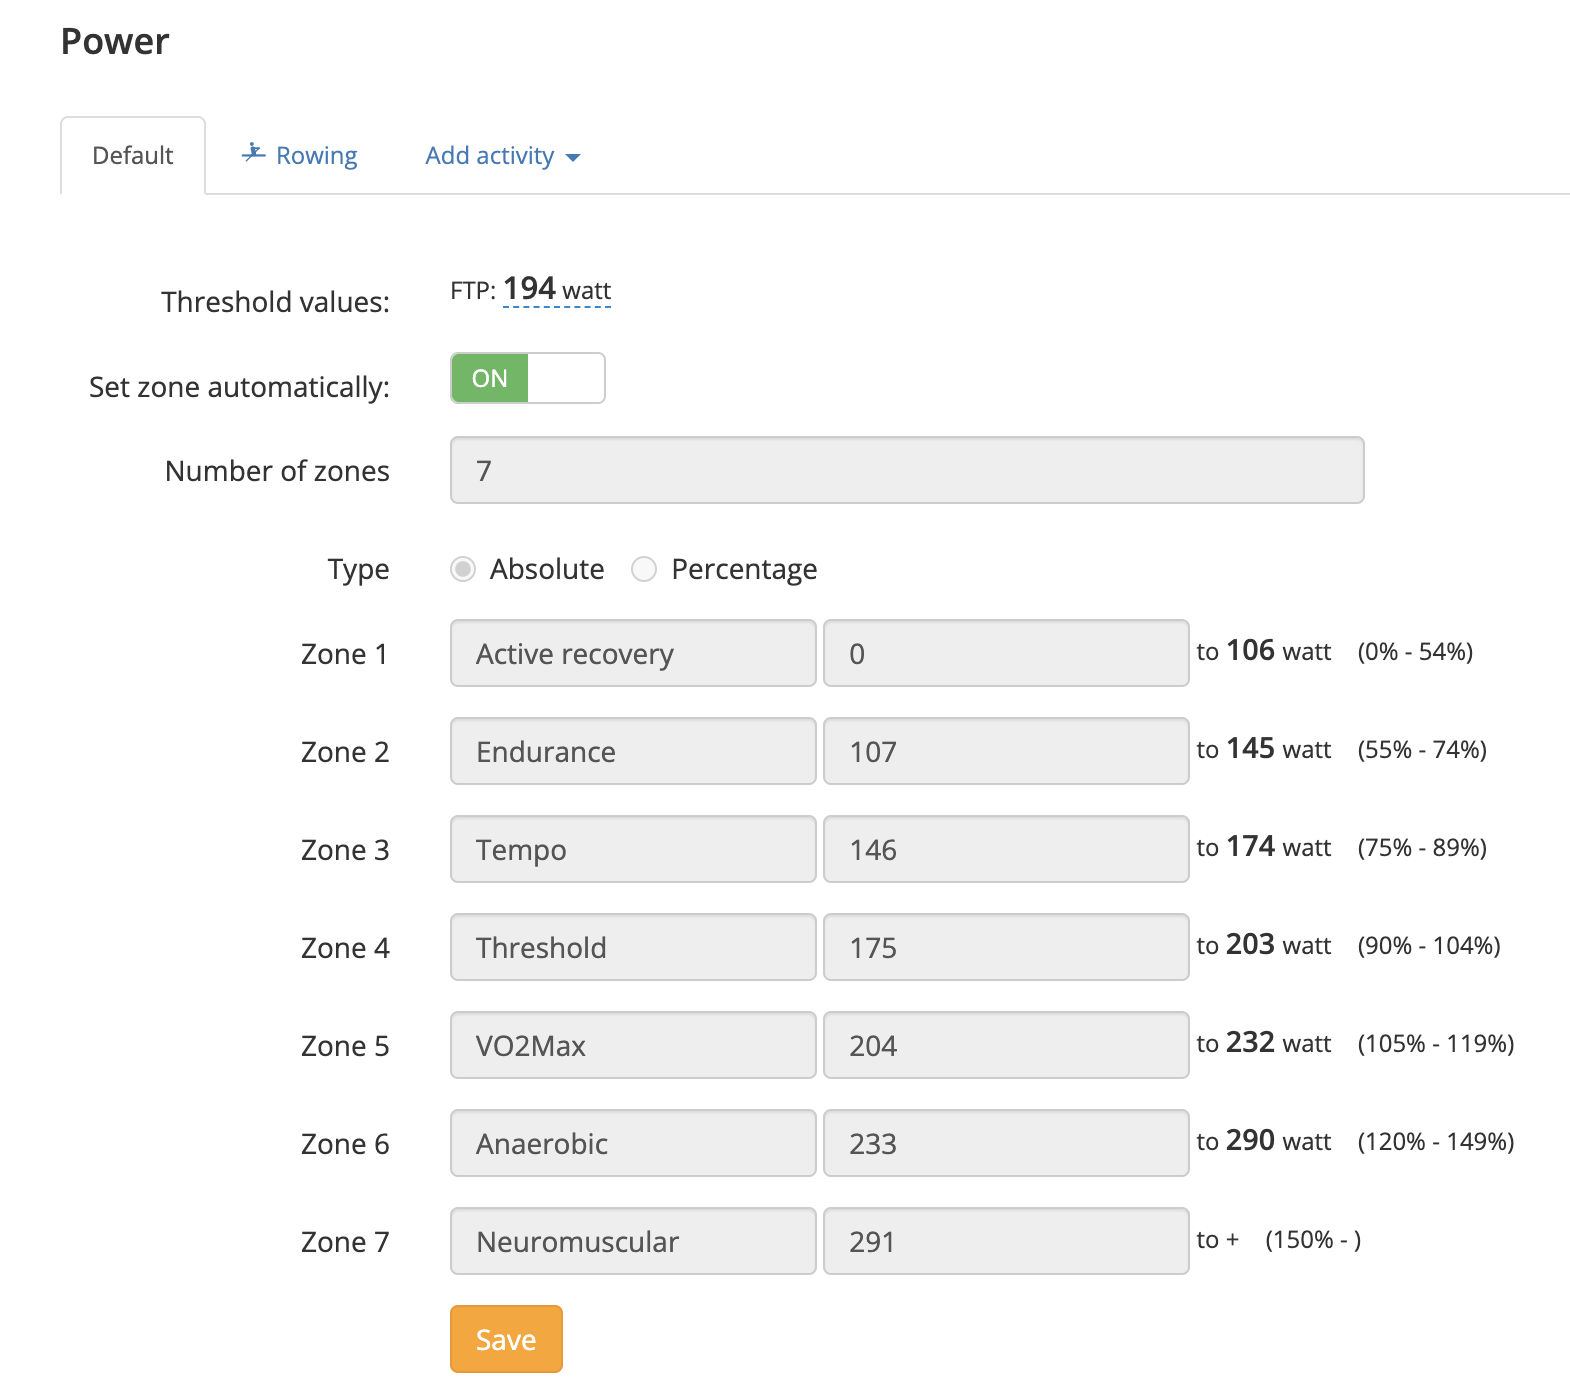
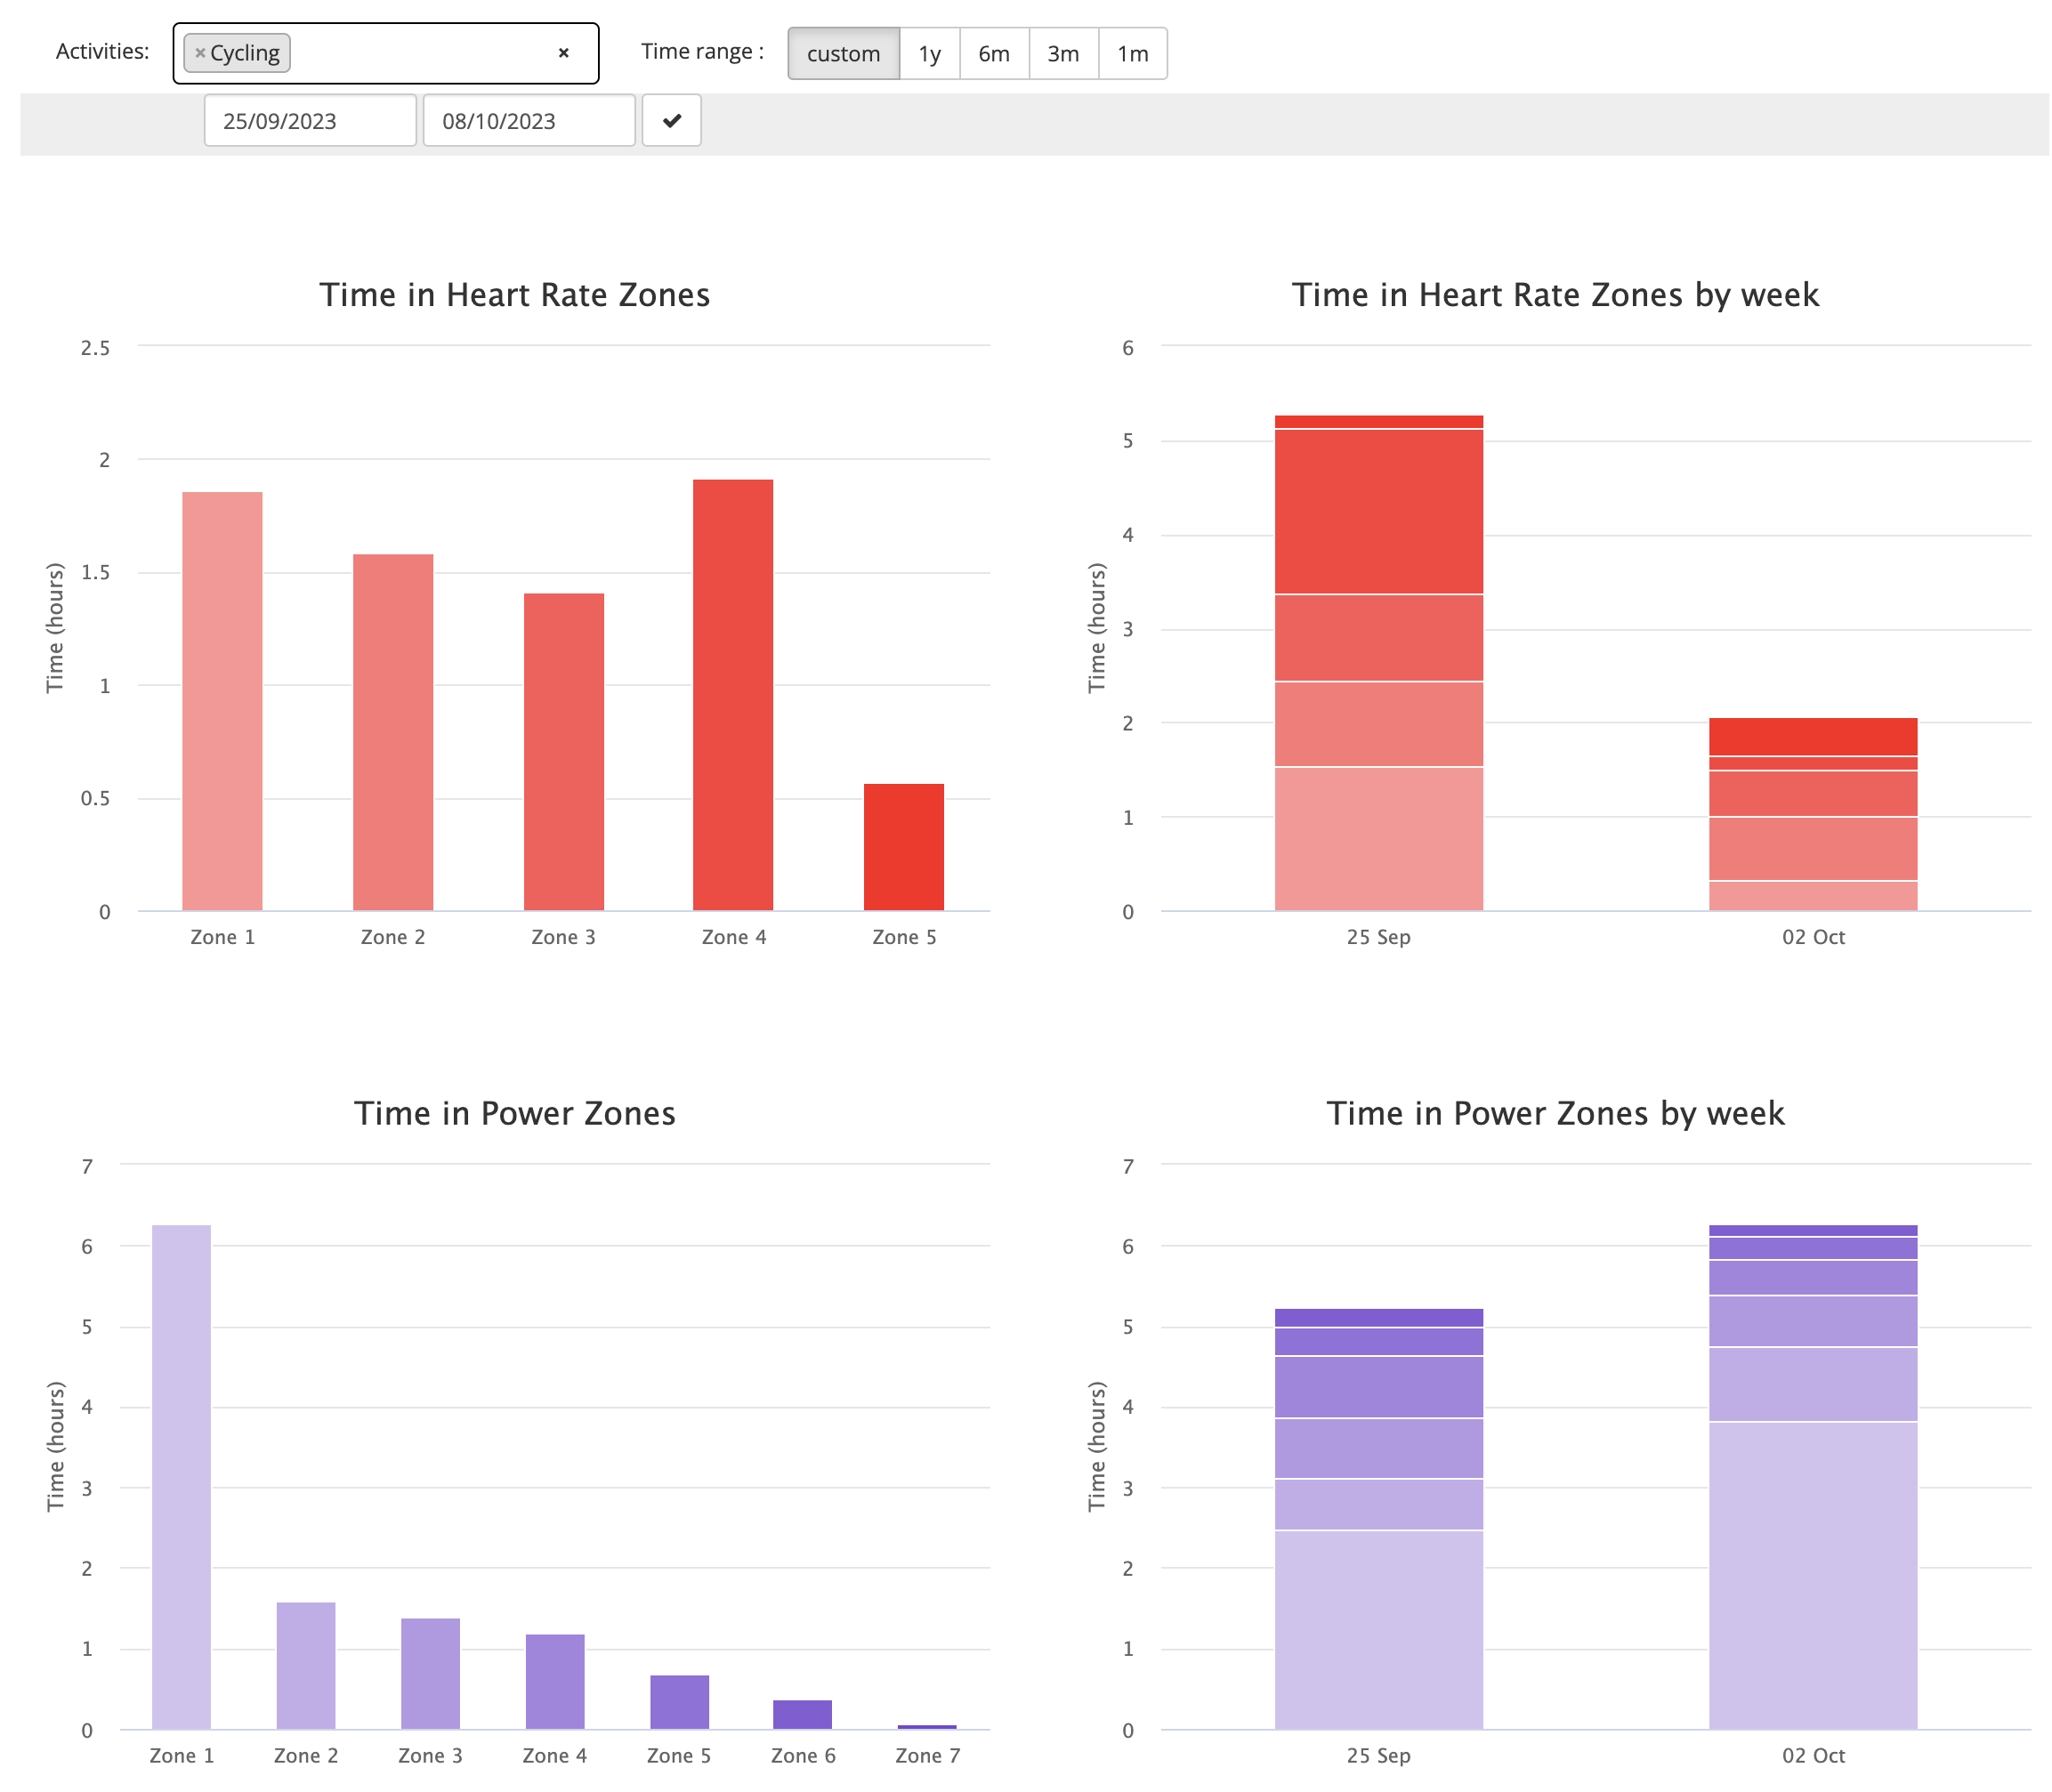
At Selfloops, we’ve incorporated the Time in Zones charts that empower athletes and coaches to track and analyze the time spent in different training intensity zones (based on heart rate, power, or speed).
You can visualize the Time in Zones for various types of activities or as a cumulative measure across all activities performed. Additionally, you can customize the start and end dates for these charts.
In this blog post, we will delve into the concepts of training in Zone 2 and explore the differences between the polarized and pyramidal approaches to zone training. Our aim is to equip you with the tools needed to optimize your athletic journey.
The Importance of Training Zones
Endurance coaches, athletes, and scientists devote considerable effort to determining the ideal blend of training session intensity, duration, and frequency to achieve desired physiological adaptations in athletes and to maximize their performance during key competitions. This process, known as training periodization, involves varying these variables throughout a training cycle.
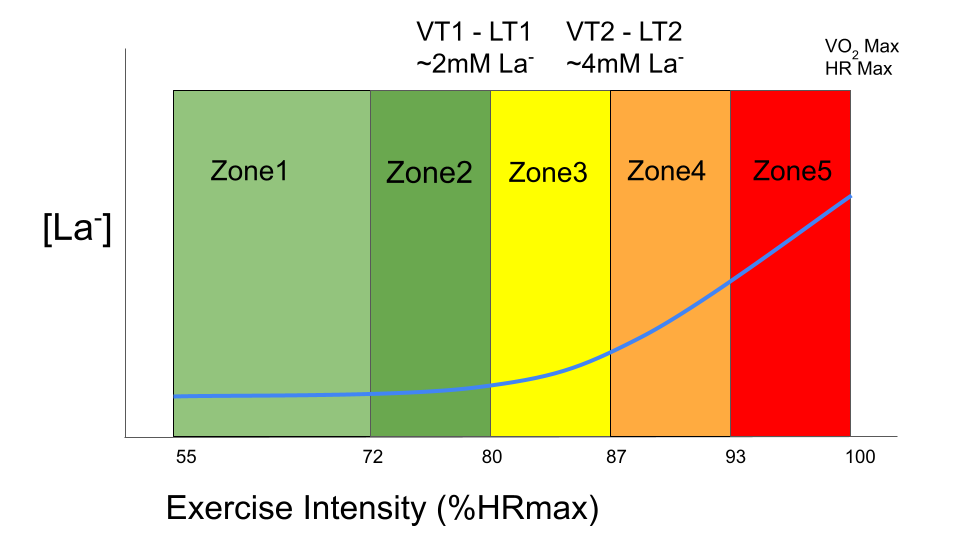
To deepen our understanding of training analysis, a range of training intensity zones has been identified. These zones are determined by physiological metrics such as lactate threshold, ventilatory thresholds, percentage of maximum oxygen uptake, percentage of maximum heart rate, or subjective criteria like perceived exertion levels.
The concept of training intensity distribution (TID) refers to the amount of time an athlete spends in different training intensity zones during an exercise. These zones provide structure to workouts and ensure that you train at the right intensity to effectively achieve your goals.
Zone 2: The Foundation for Athletes
One of the most critical training zones for athletes is Zone 2.
Zone 2 is commonly referred to as the aerobic zone. It represents a moderate intensity level where your body primarily relies on aerobic metabolism, utilizing oxygen to produce energy. Zone 2 concludes at the first aerobic threshold, such as the first ventilatory threshold or lactate threshold.
Zone 2 training is essentially about elevating your heart rate sufficiently and maintaining it for an extended duration to build aerobic fitness without reaching the point where you gasp for breath. It is the intensity level where you start to notice a shift in your breathing patterns. A simple way to identify your aerobic threshold, without a lab test, is when you transition from speaking comfortably in extended paragraphs to only managing short sentences. At this stage, you are still relatively comfortable, and you could likely sustain this effort for an extended period, although it is important to recognize that you are indeed engaged in meaningful exertion. This training is also known as aerobic training or base training.
Benefits of Training in Zone 2
- Improved Aerobic Capacity: Zone 2 training enhances your body’s efficiency in utilizing oxygen, enabling you to sustain exercise for longer durations, ultimately leading to better endurance in your chosen sport.
- Enhanced Fat Utilization: Training in Zone 2 encourages your body to burn fat for fuel, which can aid in weight management and benefit long-duration events where carbohydrate stores may become depleted.
- Reduced Risk of Overtraining: Zone 2 training is generally low in intensity, making it an excellent choice for active recovery or lighter training days. This helps prevent overtraining, reducing the risk of injuries and burnout.
Polarized vs. Pyramidal Approaches to Zone Training
Two popular training approaches that utilize training intensity distributions are the polarized and pyramidal methods. Let’s delve into these concepts in more detail below.
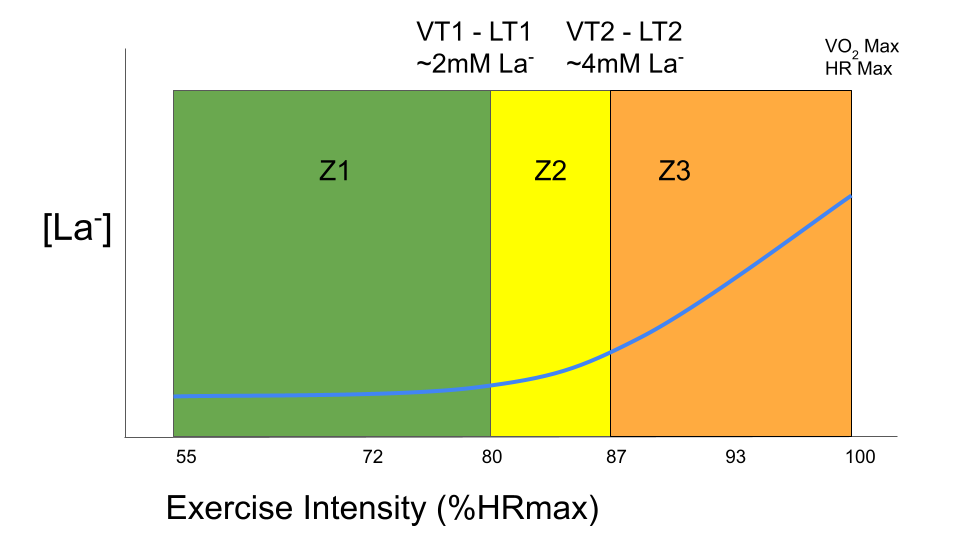
In this context, we consider the training intensity distribution based on three training zones: Z1 (below the first ventilatory threshold VT1), Z2 (between the first and the second ventilatory threshold VT2), and Z3 (above the second ventilatory threshold).
Polarized Training:
Polarized training is a method that emphasizes spending the majority of your training time at low intensity, with the remaining time dedicated to high intensity. It places less emphasis on the intensity zone between the two extremes (low and high intensity). This approach aims to maximize the benefits of both low-intensity aerobic development and high-intensity anaerobic power. In Polarized training, the intensity distribution is characterized by the highest percentage of time spent in Z1, a smaller yet relatively high percentage in Z3, and only a small portion of training in Z2.
In Polarized training Z1 > Z3 > Z2
Typically, it involves around 80% of training at low intensity (Z1), 5% at middle intensity (Z2), and 15% at high intensity (Z3).
Benefits of Polarized Training:
- Improved aerobic capacity and anaerobic power.
- Enhanced recovery due to the abundance of low-intensity training.
Pyramidal Training:
Pyramidal training, in contrast, places more emphasis on a balanced distribution across intensity zones. When considering three intensity zones (low, middle, high), pyramidal training allocates the most time to the first zone, with progressively less time spent in the other zones. The pyramidal training intensity distribution is characterized by a higher percentage of training time in Z1, less in Z2, and even less in Z3.
In a Pyramidal Training Z1> Z2 > Z3
Typically, it involves around 80% of training at low intensity (Z1), 15% at middle intensity (Z2), and 5% at high intensity (Z3).
This approach provides a well-rounded foundation for overall fitness and can be particularly beneficial for athletes who engage in various sports or events.
Benefits of Pyramidal Training:
- A balanced approach addressing multiple aspects of fitness.
- Suitable for athletes with diverse training goals.
- Reduced risk of overemphasizing a single energy system.
Conclusion
Understanding your training zones and incorporating Zone 2 training into your routine can significantly enhance your sports performance. Whether you choose the polarized or pyramidal approach, both methods offer their advantages and can help you achieve your athletic objectives. Remember that consistency and personalized training are key; what works best for one athlete may not be the ideal strategy for another. Consulting with a coach or sports scientist to tailor your training zones and methods to your specific needs is crucial, allowing you to witness your athletic performance reach new heights.
References
- Seiler, S., & Kjerland, G. Ø. (2006). Quantifying training intensity distribution in elite endurance athletes: Is there evidence for an “optimal” distribution? Scandinavian Journal of Medicine & Science in Sports, 16(1), 49-56. doi: 10.1111/j.1600-0838.2004.00418.x
- Seiler, S. (2010). What is best practice for training intensity and duration distribution in endurance athletes? International journal of sports physiology and performance, 5(3), 276-291. Doi: 10.1123/ijspp.5.3.276
- Iñigo San Millán Zone 2 Link
- Deep dive back into Zone 2 Training with Iñigo San-Millán link
- SimplaVida, Zone 2 Training
- Jason Koop, Koopcast Polarized vs Pyramidal Training with Luca Filipas PhD | Koopcast Episode 113
- Valenzuela PL, Morales JS, Foster C, Lucia A, de la Villa P. Is the Functional Threshold Power a Valid Surrogate of the Lactate Threshold? Int J Sports Physiol Perform. 2018 Nov 20:1-6. doi: 10.1123/ijspp.2018-0008.
- Stöggl T, Sperlich B. Polarized training has greater impact on key endurance variables than threshold, high intensity, or high volume training. Front Physiol. 2014. doi:10.3389/fphys.2014.00033
- Stöggl TL, Sperlich B. The training intensity distribution among well-trained and elite endurance athletes. Front Physiol. 2015. doi:10.3389/fphys.2015.00295
- Treff G, Winkert K, Sareban M, Steinacker JM, Sperlich B. The polarization-index: a simple calculation to distinguish polarized from non-polarized training intensity distributions. Front Physiol. 2019. doi:10.3389/fphys.2019.00707
- Treff G, Winkert K, Sareban M, Steinacker JM, Becker M, Sperlich B. Eleven-week preparation involving polarized intensity distribution is not superior to pyramidal distribution in national elite rowers. Front Physiol. 2017. doi:10.3389/fphys.2017.00515
- Neal CM, Hunter AM, Brennan L, et al. Six weeks of a polarized training-intensity distribution leads to greater physiological and performance adaptations than a threshold model in trained cyclists. J Appl Physiol. 2013; 114(4): 461-471. doi:10.1152/japplphysiol.00652.2012
- Muñoz I, Seiler S, Bautista J, España J, Larumbe E, Esteve-Lanao J. Does polarized training improve performance in recreational runners? Int J Sports Physiol Perform. 2014; 9(2): 265-272. doi:10.1123/IJSPP.2012-0350
- Filipas, Luca, et al. Effects of 16 weeks of pyramidal and polarized training intensity distributions in well‐trained endurance runners. Scandinavian journal of medicine & science in sports 32.3 (2022): 498-511. doi: 10.1111/sms.14101
- Esteve-Lanao, J., San Juan, A.F., Earnest, C.P., Foster, C. and Lucia, A., 2005. How do endurance runners actually train? Relationship with competition performance. Medicine & Science in Sports & Exercise, 37(3), pp.496-504. doi: 10.1249/01.mss.0000155393.78744.86