Calculating your Heart Rate Variability with SelfLoops

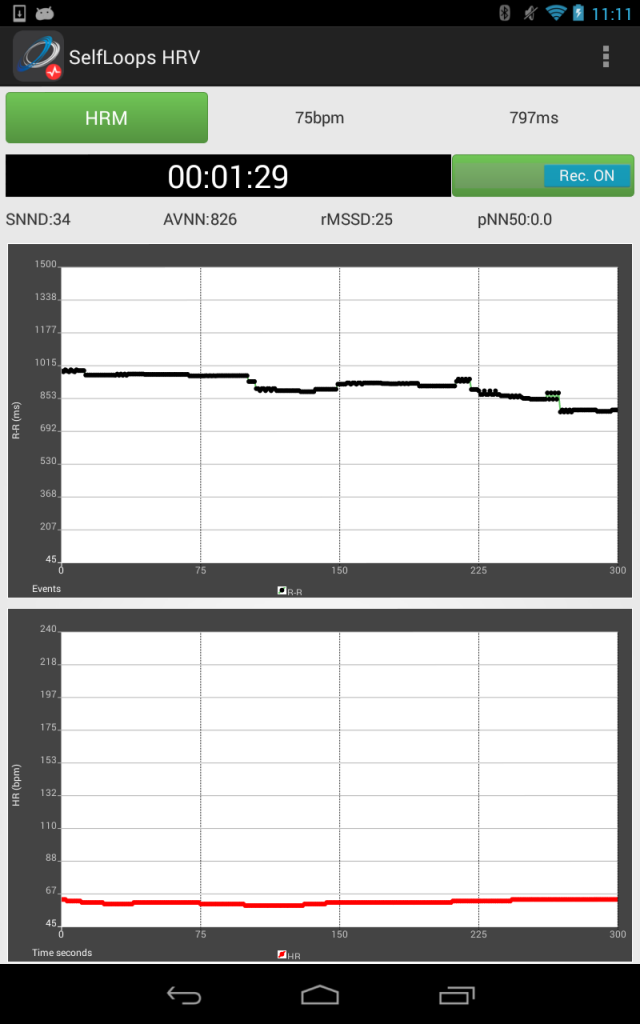
The SelfLoops HRV application calculates and displays the heart rate variability.

Heart rate variability (HRV) is the physiological phenomenon of variation in the time interval between heartbeats. It is measured by the variation in the beat-to-beat (called R-R) intervals. For an intro to HRV see: http://en.wikipedia.org/wiki/Heart_rate_variability

The metrics calculated at the moment are: SDNN, RMSSD, pNN50, AVNN.

To use the application you need a Bluetooth Low Energy heart rate monitor. We have personally tested the application with the Viiiva, Wahoo BlueHR and Polar H7 heart rate monitors.
The Viiiva is available at our store: http://store.selfloops.com/viiiiva-heart-rate-monitor-and-ant-bridge/

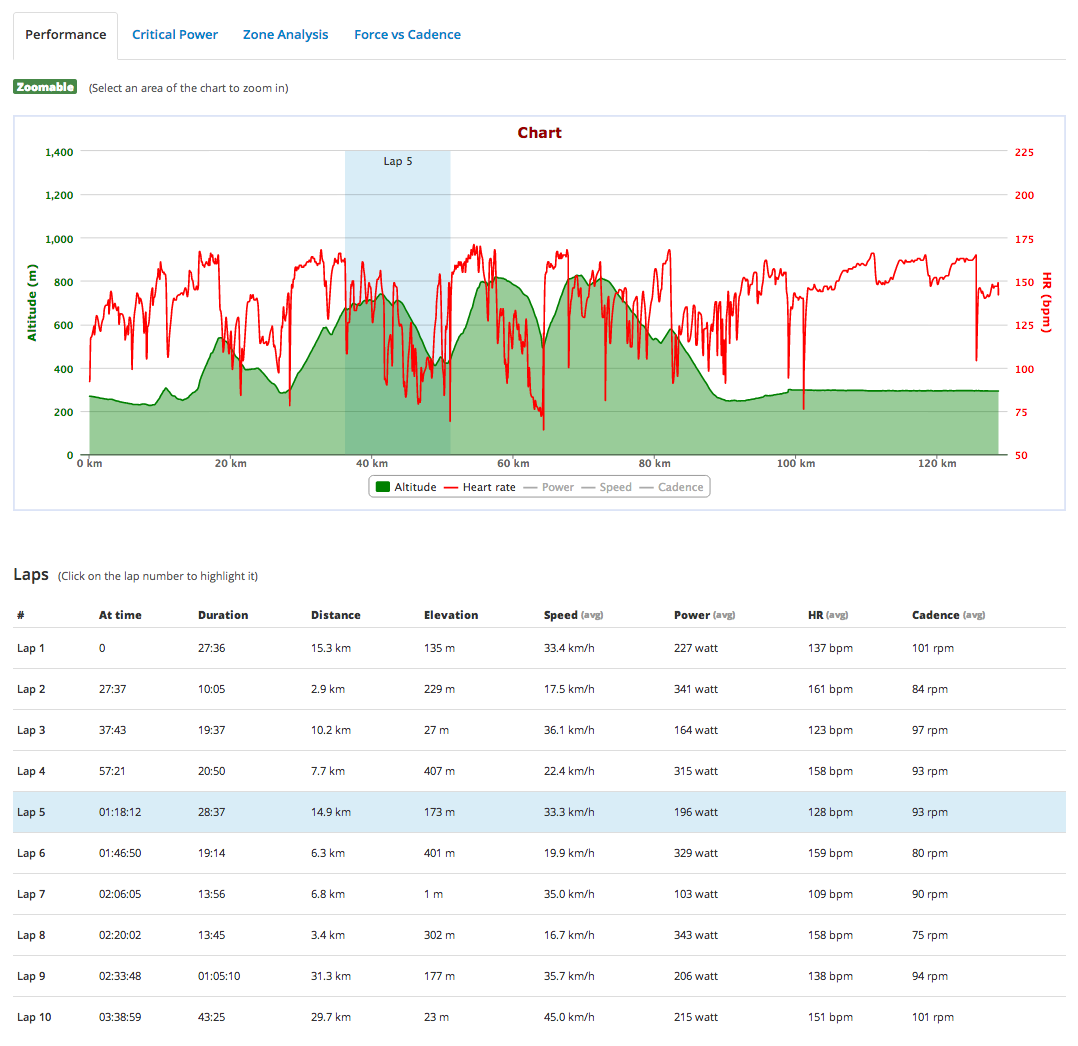
If you record the session you will be able to export the data, saved in csv format, to Dropbox, Google Drive, by email etc, and open it using Microsoft Excel, a text editor, Apple Numbers.

By using the application you expressly agree that SelfLoops is not providing medical advice with this application. Please, consult or ask for the advice to your physician or other medical professionals for any health related questions.

Screenshot_2014-02-13-11-11-19


Announcing lap support and data visualization improvements

We are constantly working to improve our advanced platform for performance analysis. Today we have introduced laps support and improvements on how the graphs show data.

You can now select the lap number and highlight the segment in the graph. For each lap we have calculated several metrics such as duration, elevation, average speed, power and cadence. You can visualize the lap in the map as well.

Screen Shot 2014-01-14 at 2.39.54 PM


Regarding the improvements with the graphs, we have maximized the information visualized at glance. Furthermore, the zoom function allows to show every single data point of the activity, reaching the maximum level of accuracy possible.

Enjoy!


Are you ready to start strong in 2014?

First of all Merry Christmas and Happy New Year!

Are you ready to start strong in 2014? We have a lot of news to share with you.

Pro teams choose SelfLoops
The Androni Giocattoli Venezuela uses SelfLoops to manage the team performance.

androni

SelfLoops Group Fitness 
With the SelfLoops Group Fitness solution you can monitor indoor sessions and cardio workouts. This service is successfully used around the world by personal trainers, gyms and in training events.
Now we have created the SelfLoops Group Power, to monitor bike power sensors in indoor group sessions. For people that are serious about performance!

banner-power


You can only improve what you measure
We are constantly improving our platform. We have added metrics to track your performance and fitness form. Coaches can manage the team calendar, monitor the athletes performance, create training plans, write  race reports. Only 45€/year! Sign up at our website (1 month free trial).

Screen Shot 2013-10-26 at 10.37.17 AM


Telemetry
Stream your trainings in real-time, with the SelfLoops telemetry. It can be used both indoor and outdoor. And you can stream single or group of athletes at the same time. Make your trainings and events more entertaining. Measure your aerodynamics. Read more about it at our website.


velodrome

The SelfLoops store
To track your activities you need devices and tools, you can find them at our store.

If you want to enable ANT+ in your Android device to connect to heart rate monitors, bike cadence and speed sensors, bike power sensors read our how-to tech guide.

Advanced Performance Analysis by SelfLoops

Today we announce the addition of the Force vs Cadence graph to our advanced performance analysis toolbox.  You can only improve what you measure (and analyze).

In our performance analysis we have the:

  • graph with the map and all the stats (max, averages, and other performance metrics such as TRIMP, Intensity, Effective Power, Training Load)
  • Training zones (where you spent the time during your workout)
  • graph with the current and historical Critical Power
  • the Force versus Cadence graph
  • The Fitness and Freshness graph (measures your form)
  • The Health status with weight, Functional Threshold Power, maximum and at rest heart rate
  • Historical Critical Power and Maximum Power Output (W/Kg)
Overall all that you need to analyze your performance and take the steps to improve.

Click to enlarge the images below.