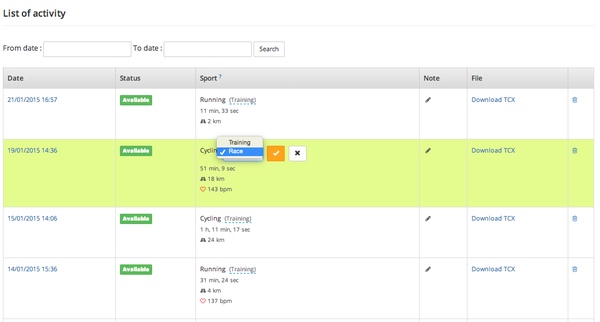
Many were asking and it is now available. That is the ability to highlight “Races” on your calendar and have statistics about them on SelfLoops.com
Category: Updates
Managing many users with SelfLoops Group Fitness
Do you manage several users with the SelfLoops Group Fitness app? Check how to do it with the SelfLoops Cloud, slides number 10 and 11!
SelfLoops and Kinomap
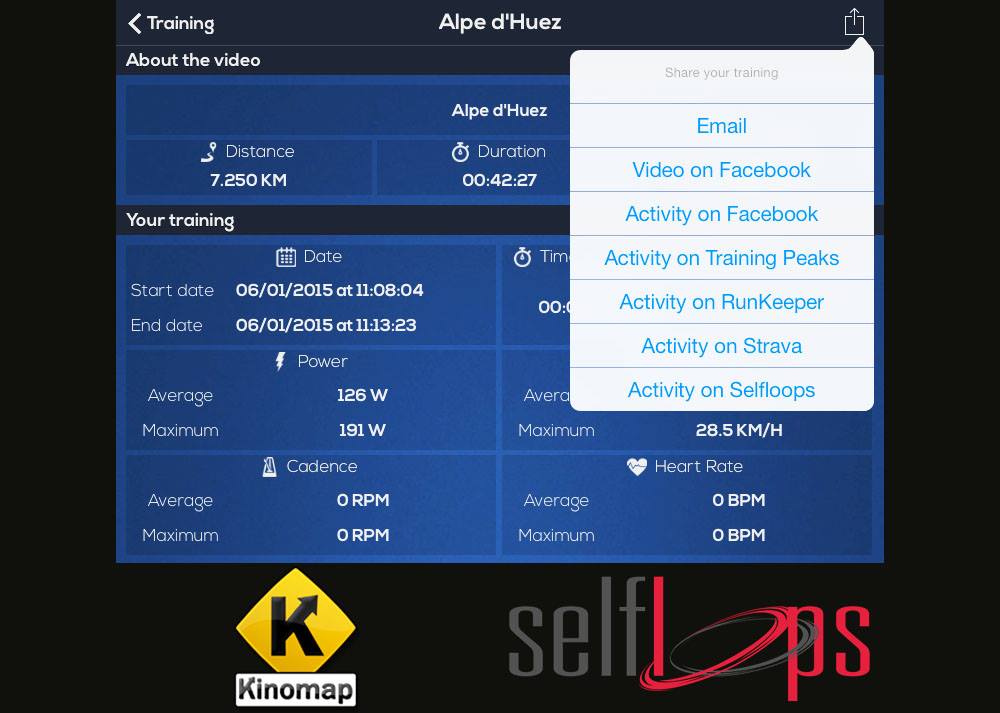
You can now upload your session from the Kinomap trainer app on SelfLoops.
With Kinomap you can:
- Record your videos along with a GPS signal while moving
- Browse videos from the website
- Share to Facebook, embed on your blog
- Replay videos from the community on your fitness equipment
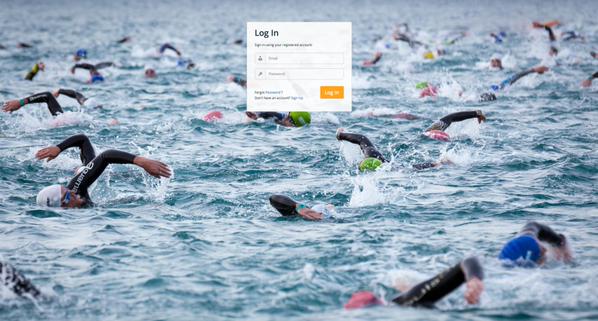
Open water swimming analysis in SelfLoops
Indoor training
If you use PerfPRO, It4Cycling, FulGaz and Kinomap or the GoldenCheetah indoor training software, you can now easily upload your sessions on SelfLoops ( integration coming soon). You can also automatically import files using any Garmin, Powertap/CycleOps and Sportek.it devices. And we support FIT, TCX and SRM files. All you need to track and analyze your activities. And more to come, stay tuned.


