Nice video of the Selfloops Group Fitness service in Korea
Finally, Automatic Sync with Garmin Devices
We have enabled the ability for your Garmin workouts to automatically appear in Selfloops within about 10-seconds of you completing the workout.
This means that for any Bluetooth/WiFi enabled Garmin devices, you’ll be able to get the workouts to Selfloops without being near your computer.
And, for those with older devices like the FR310XT/910XT that use the ANT Agent (or Garmin Express) software, you’ll still get your workouts to Selfloops without the need for the manual upload.
Just link your Garmin Connect Account on Selfloops (a premium account is required)
Selfloops syncs with many other services already. These include Strava, the Withings scale, GoldenCheetah, Powertap Power Agent, SRM Device Agent, our HRV app.
Keep track of all your activities across different services in the Selfloops website.
Winners use Selfloops
Alexander Foliforov (Gazoprom RusVelo pro team) wins stage 15 of Giro d’Italia. Damiano Cunego (Nippo Fantini) leads the Blue Jersey classification. All powered by Selfloops!

Quantify your efforts with the TRIMP score
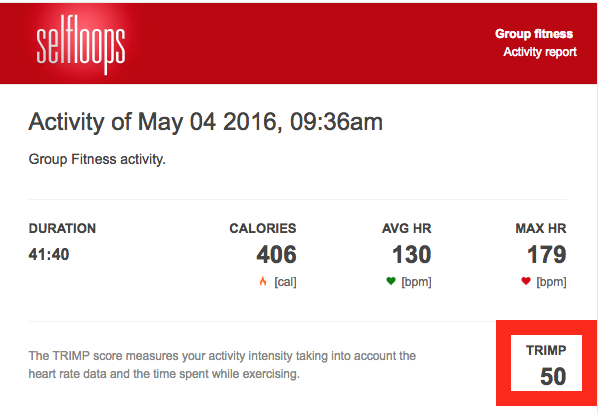
We have now included the TRIMP score in the Group Fitness email reports.
The TRIMP (TRaining IMPulse) score measures the activity intensity. The harder and longer you train, the higher will be your TRIMP.
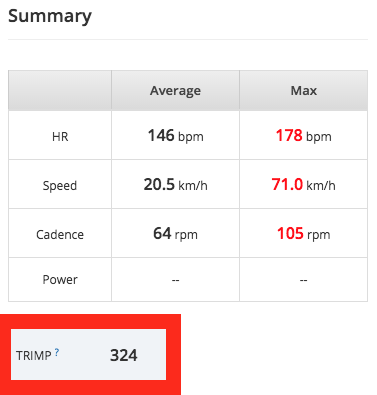
The TRIMP score is calculated for every activity where a heart rate monitor is used. Also available in our website for indoor and outdoor sports activities.


Winning teams use Selfloops
Giro del Trentino 2016, Stage 2. Two out of three of the riders in the podium use Selfloops to track and analyze sports performance! Congrats Nippo–Vini Fantini and Gazprom-RusVelo nice to see such photo! (photo credit Stefano Sirotti)

Settimana Internazionale Coppi e Bartali 2016, Stage 1b (TTT). Two of the teams in the podium use Selfloops! Well done Gazprom-RusVelo and Unieuro Wilier.


