Analyze your power output

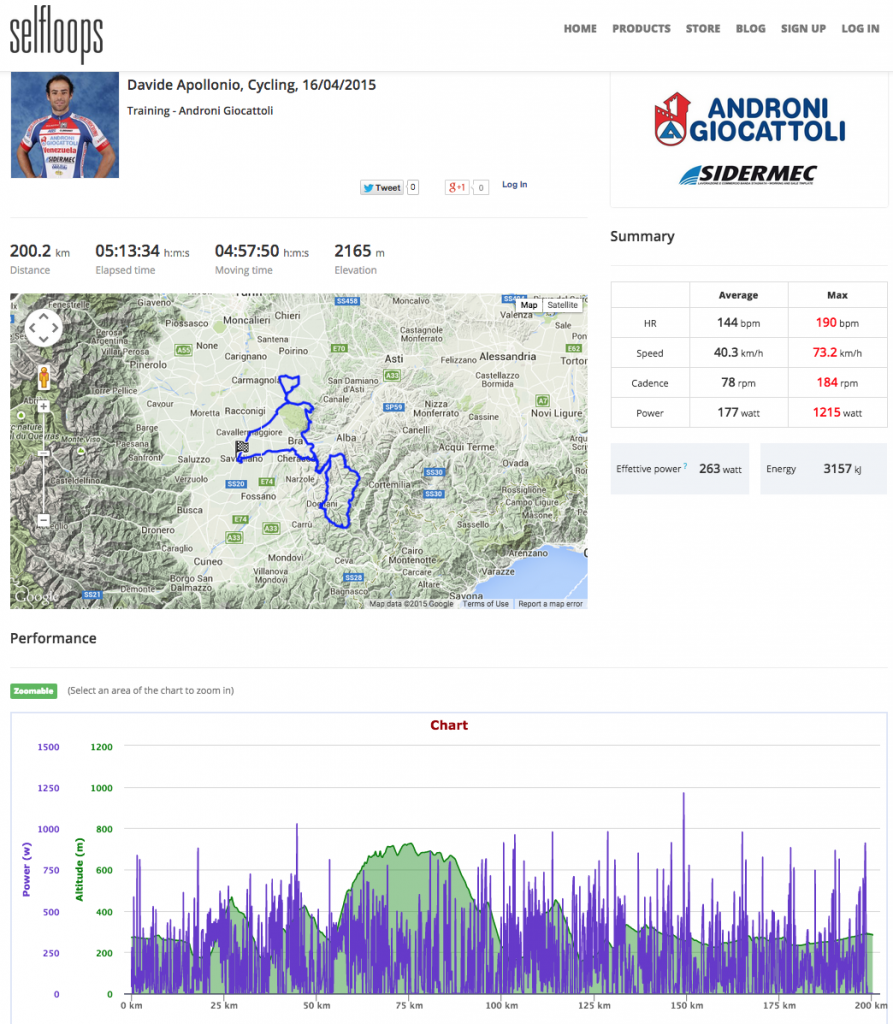
We have just improved our bike power analysis with line graphs showing your Maximum Power Output (Watts/KG).
The Maximum Power Output is your Critical Power* divided by your weight. The weight normalizes the measure and you can compare your Maximum Power Output with other cyclists. In this new software update you can also set the time range over you want to analyze your Critical and Maximum Power Output.

*Critical Power or Mean Maximal Power, is the best average power you can maintain for a given amount of time. For example a CP5 of 500W means the rider was able to sustain an average of 500W for 5 seconds as its best performance in all his rides. A sprinter will have very high values for CP5.

Screen Shot 2015-03-13 at 10.45.43 AM

Announcing Moxy support

We are happy to announce that we have included the support for Moxy.

Moxy is an innovative device that uses infrared light to continuously monitor oxygen saturation (SmO₂) levels in the muscles of athletes while they exercise.
Oxygen is the fuel that drives the muscle, and Muscle Oxygen levels are constantly changing.
Moxy is used to assess athletes, guide their training, and hone their performance during competition. It helps identify optimal training intensity zones and provides feedback on the physiologic systems limiting performance.

Moxy-BANNER-logo

Now with SelfLoops you can analyze how the Total Hemoglobin Concentration (THb measured in g/dL) and the Percentage of hemoglobin saturated with oxygen (Smo2 %) vary while exercising.

These are additional metrics that can be used to evaluate and measure your trainings.

Since Moxy conforms to the ANT+ Muscle Oxygen profile, we have added this profile to our indoor bike power training service. Basically, train with our app, automatically upload your data on SelfLoops and get all the analysis on your workout, including THb and and Smo2, on the SelfLoops website.

You can only improve what you measure!
Screen Shot 2015-03-06 at 7.37.35 PM


New design to help you manage a team

For clubs and teams that want to manage and monitor their athletes, we have just launched the new dashboard.
With the new design it is easy, at glance, to see how the team is performing and who are the most active athletes.

It is possible to order the athletes by using several fields and a data range can be selected.
Overall a great addition to the tools we offer to coaches to monitor athletes performance.

Screen Shot 2015-02-25 at 1.33.07 PM

Keep your heart rate variability under control

Keep your heart rate variability under control with the SelfLoops HRV app. The SelfLoops HRV app measures the heart rate variability using Bluetooth Smart or ANT+ heart rate monitors in Android and iOS.

Heart rate variability (HRV) is the physiological phenomenon of variation in the time interval between heartbeats. It is measured by the variation in the beat-to-beat (called R-R) intervals. It is a metric that is used to analyze and evaluate stress and overtraining.

The application can upload the HRV measurements in the SelfLoops website. You’ll have all your sport activities and hrv values stored and organized, to be able to keep track how exercises influence your heart rate variability.

In a graph view, in a calendar view and in a tablet view.

Screen Shot 2015-02-15 at 10.01.33 AM


Screen Shot 2015-02-15 at 9.48.44 AM