The physiological effect of an athlete’s training can be measured in terms of their training load, which quantifies the impact of a workout on the body by considering its intensity and duration. The concept of training load was introduced by Banister et al in 1975 in an article titled “A systems model of training for athletic performance.” *
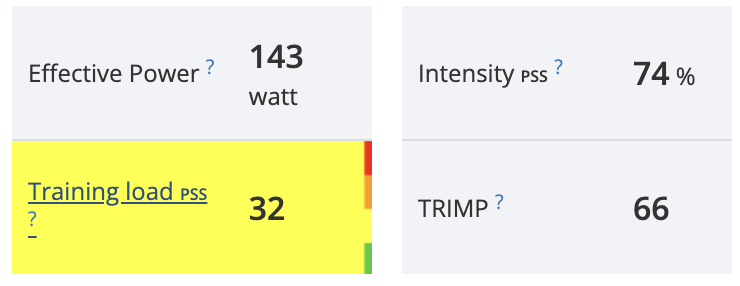
In SELFLOOPS, the Training Load is calculated after each session and is accompanied by the Effective Power, Intensity, and TRIMP score.
Effective Power is a weighted average power that takes into account ride variability, while Intensity measures how hard a workout was by calculating the ratio between the athlete’s effective power and their FTP. TRIMP is a metric based on heart rate that captures the stress of an activity in a single number and is used to evaluate the effect of training over time.

The training load can be accumulated over multiple sessions. This metric enables the coach to monitor the athlete’s progress and prescribe an effective training program.
At the end of each week in SELFLOOPS you can visualise the accumulated training load, the workout duration, the distance, the TRIMP score and the calories burned.

To find a delicate balance between increasing training load and resting to allow for recovery and adaptation, the athlete and coach must work together. A good training plan includes periods of training mixed with active recovery and tapering sessions. This concept, known as periodization, considers the athlete’s competitions and form.
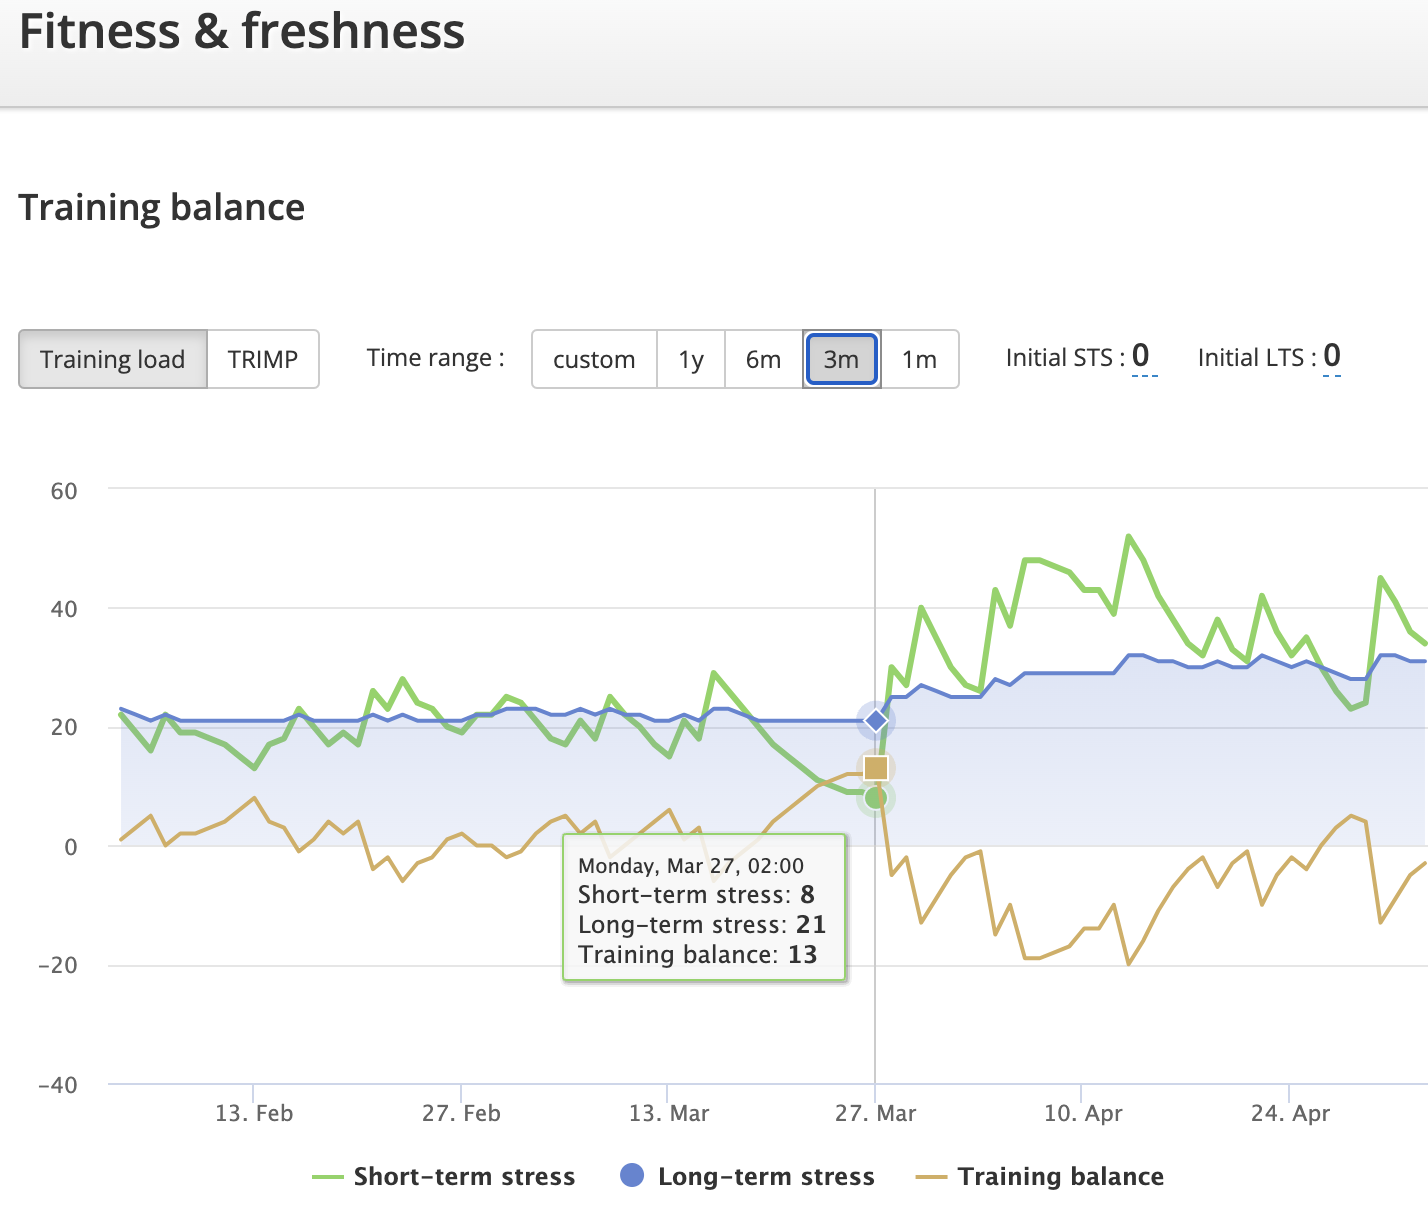
To monitor the training balance between training and recovery, SELFLOOPS provides the Fitness and Freshness Chart. The chart allows coaches to track an athlete’s fitness, fatigue, and form over time and use these metrics to guide the athlete to achieve their goals.
The Fitness and Freshness chart uses the accumulated Training Load to model the athlete’s form. Training sessions build long-term stress (fitness) or “chronic training load,” which is required to compete. However, they also cause short-term stress or “acute training load” adaptation, which results in fatigue. The balance between short-term and long-term stress determines the athlete’s training balance or “form.”

Training load can be quantified in different ways depending on the data available. Heart rate data can be used to calculate the TRIMP score or the Heart Rate Stress Score (HRSS), which is based on the lactate threshold heart rate. Bike power meter data can be used to calculate the Power Stress Score (PSS), while speed and distance data can be used to calculate the Swimming Stress Score (SSS) and the Running Stress Score (RSS).
Each activity with a stress score causes its own amount of fatigue and fitness, with a higher training load resulting in higher stress provided to the body. The Fitness and Freshness chart uses the activities’ Training Load to model the athlete’s fatigue, fitness, and form over time.
*Banister EW, Calvert TW, Savage MV, Bach TM. A systems model of training for athletic performance. Australian Journal of Sports Medicine. 1975;7:57–61