We are constantly working to improve our advanced platform for performance analysis. Today we have introduced laps support and improvements on how the graphs show data.
You can now select the lap number and highlight the segment in the graph. For each lap we have calculated several metrics such as duration, elevation, average speed, power and cadence. You can visualize the lap in the map as well.
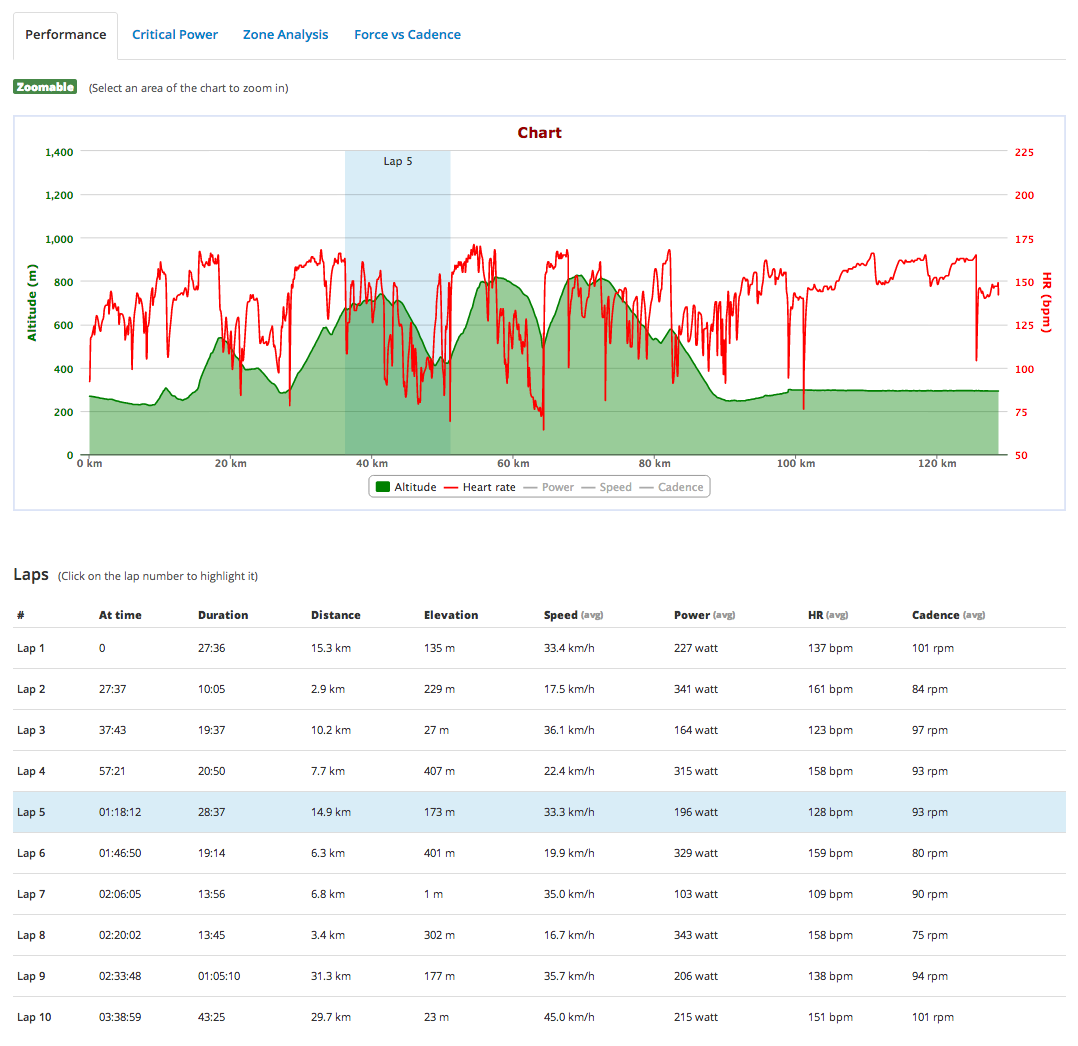
Regarding the improvements with the graphs, we have maximized the information visualized at glance. Furthermore, the zoom function allows to show every single data point of the activity, reaching the maximum level of accuracy possible.
Enjoy!