Athletes and coaches are used to analyze the so called Critical Power (CP) curve. The CP curve shows the power an athlete can sustain for a certain period of time. For example a CP5 of 500W means the rider was able to sustain an average of 500W for 5 seconds as its best performance in all his rides. See our previous post Analyze your power output.
Today, we have added an additional metric to the CP analysis, that is the average heart rate during that effort. The heart rate metric adds an additional insight and quantifies the impact of that effort on the body.
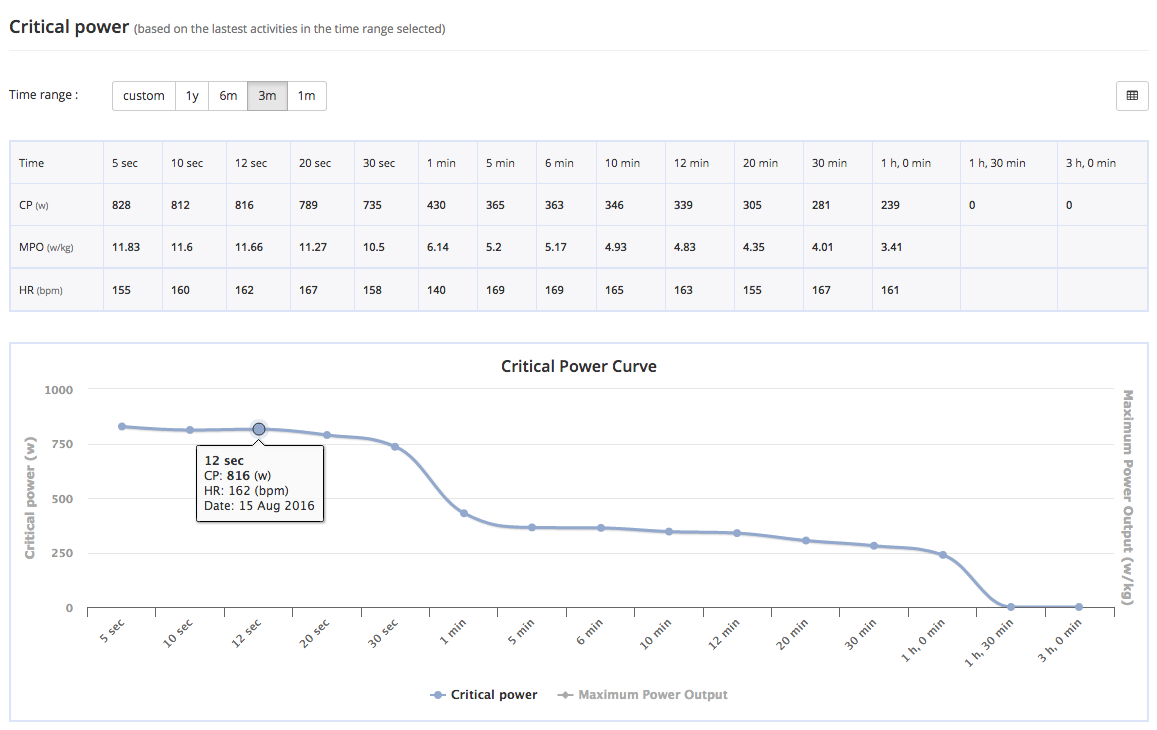
The Critical Power analysis can be used with bike power, rowing power and running power.
At equal power performances, the lower heart rate highlights an athlete in a better shape and form.
With the Peak Power Evolution line chart, it is possible to follow the evolution of each CP line (CP5 seconds,CP10 seconds,etc.) and how the power and heart rate evolve with time. The range period can be selected.
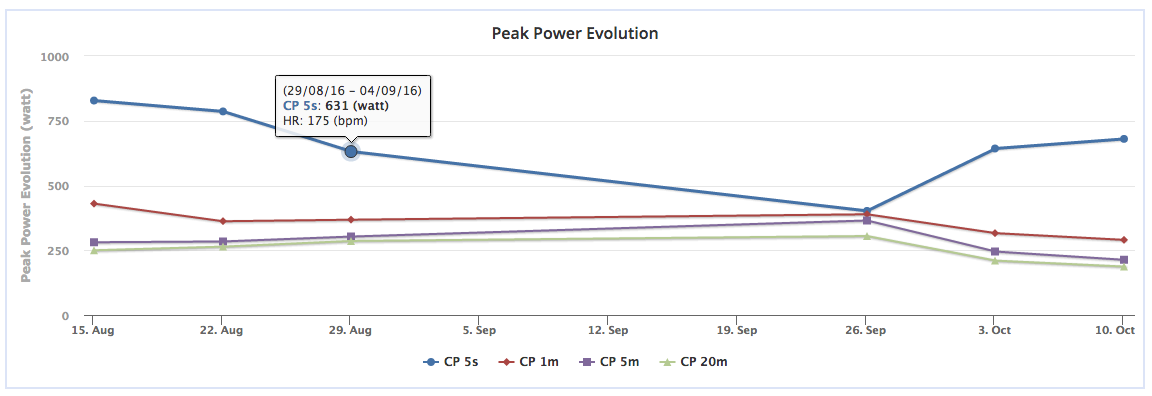
We believe this is an additional advanced analysis that can be used to help athletes improve and reach their potential.