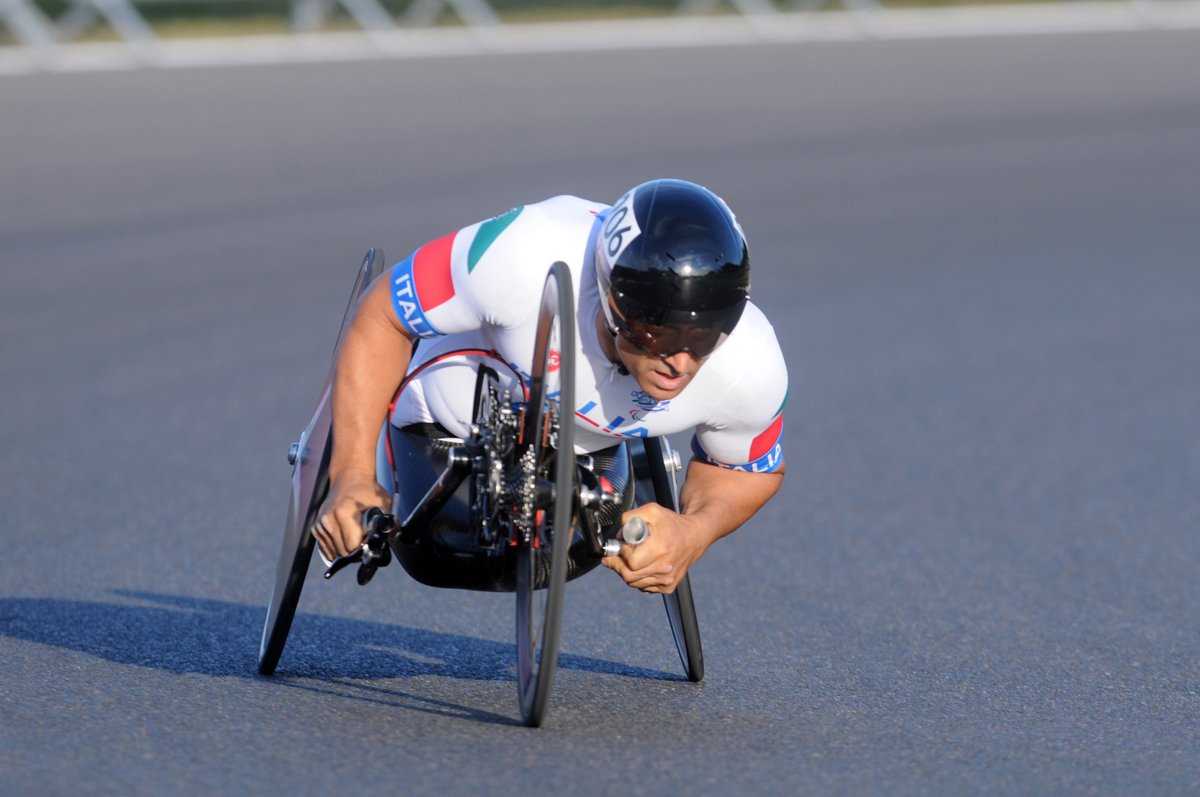
Italian national team with the Selfloops telemetry

For a coach having a real-time understanding of the bike power (Watts), cadence and heart rate expressed by cyclists is important. At Selfloops we have built a telemetry service that allows to track, store and analyze sport performance data in real-time.
In the photos below you can see the Italian National team Under 23 being followed by coaches using our telemetry software.

telemetria-nazionale

nazionale2

Powertap and Selfloops

Powertap and Cycleops devices play nicely with Selfloops.

If you have a PowerTap bike power sensor (or trainer) or if you use their VirtualTraining platform you can easily upload your sessions on Selfloops.
You can use:

With the PowerTap application on iOS, just enable the Selfloops upload on the Cloud Services section, under Settings.

IMG_0480

In VirtualTraining, enable Selfloops on the Share Training section:
Screen Shot 2016-01-16 at 11.16.15 AM

In DeviceAgent, enable a checkbox to upload data on Selfloops:
Screen Shot 2016-01-16 at 11.37.26 AM

Group Fitness and Garmin VivoSmart HR

The Garmin Vivosmart HR is a wrist activity tracker (non-watch) with optical HR capabilities watch has an optical HR Sensor.

GarminVivoSmartHR
As DCRainmaker puts it in his review.
The Vivosmart’s optical HR sensor serves roughly three purposes:

A) Ability to monitor HR 24×7 (including resting HR)
B) Ability to monitor HR during a workout (running primarily)
C) Ability to re-broadcast your HR over ANT+ to other ANT+ devices

Point C means  you can use it with our Group Fitness service since it can rebroadcast the HR signal.

From DCRainMaker:

To do this, on the Vivosmart HR you’ll have to dig into a bunch of menus.  It’s as if someone is making this complex on purpose.  You’ll press the button > Settings> Swipe 5 times to Heart Rate > Swipe to Broadcast Mode > Tap to Start Broadcasting.  Then see this:

GarminVivoSmartHRBroadcast


Your year in review with Trends

With the Selfloops platform, we offer an easy way to keep track of your fitness and sport activities intensity level.

You can select, for example, the Selfloops Trends feature and visualize how your TRIMP changes over time. The TRIMP score measures your activity intensity taking into account the heart rate data and the time spent while exercising. This is an easy and immediate way to see how hard you have worked during the year.

In the picture below the bar chart shows your accumulated TRIMP score for each month, and the line chart shows the number of the activities performed in that month.

Screen Shot 2015-12-21 at 11.45.15 AM

If you use a bike power meter, instead of the TRIMP score, you can use the Training Load, that measures the activity intensity using the bike power (Watts) and the time spent while riding.

Any way, Selfloops Trends allows you to easily keep track of your efforts at glance.