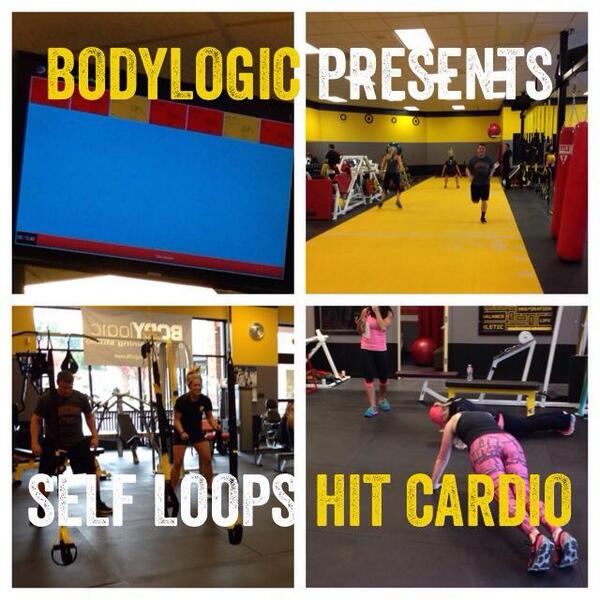
The SelfLoops Group Fitness application is a powerful service for group heart rate sessions and cardio training.
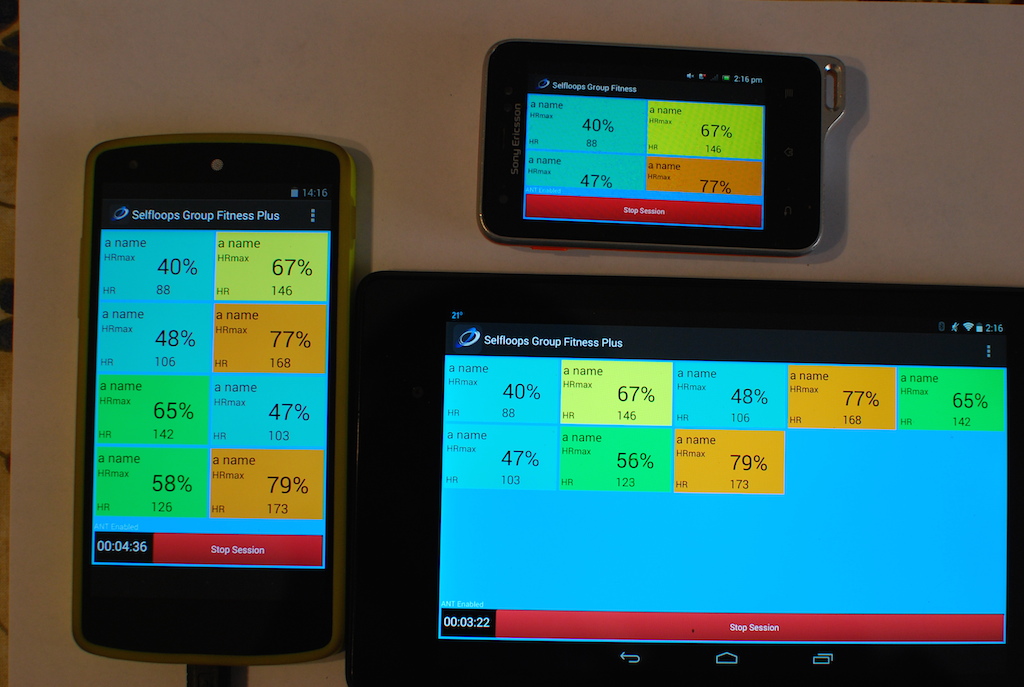
In the picture below we show its flexibility as it is able to adapt to a variety of different screen sizes and devices. In the image we have the Nexus 7, the Nexus 5 and the Sony Xperia Active.
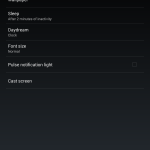
And if this is not enough, you can project the device’s screen on an external larger display such as TVs or projectors. If the device has a video output port you just need a cable, otherwise you can wirelessly stream your sessions using the Miracast technology.