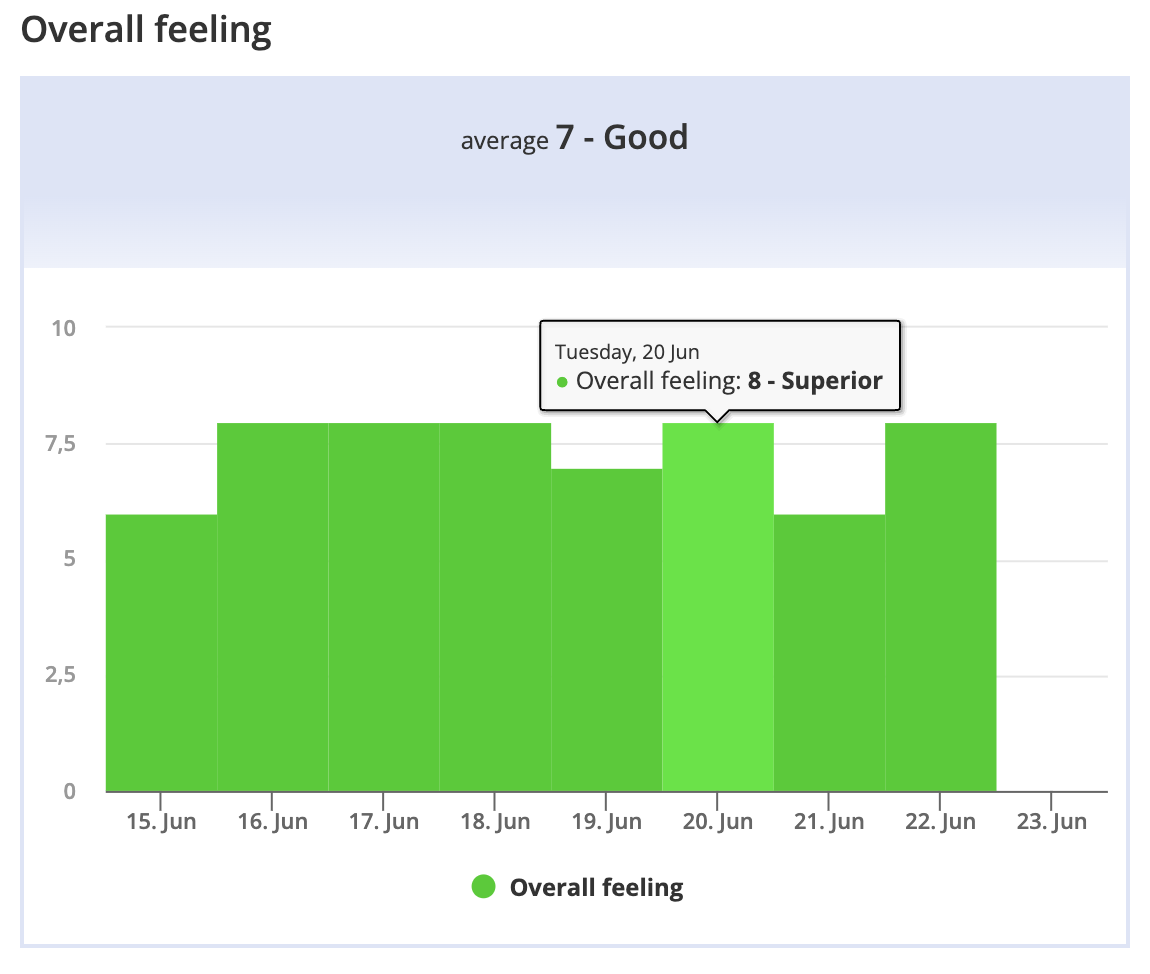
Sports performance is highly influenced by our daily state of mind and well-being. Each day brings a unique set of circumstances, with some days brimming with energy and others where our mood may not be at its best. Recognizing this, we have introduced a new metric called “Overall Feeling” to enhance our understanding of sports performance and empower coaches and athletes to make improvements.
To include the Overall Feeling metric in an athlete’s calendar, simply navigate to the desired day and click the “+” sign. From there, select “Add Metric” and choose “Overall Feeling.” Additionally, our smartphone apps now offer the convenience of adding this metric on the go. The scale ranges from 1 (Horrible) to 10 (Best), allowing individuals to easily quantify their emotional state.

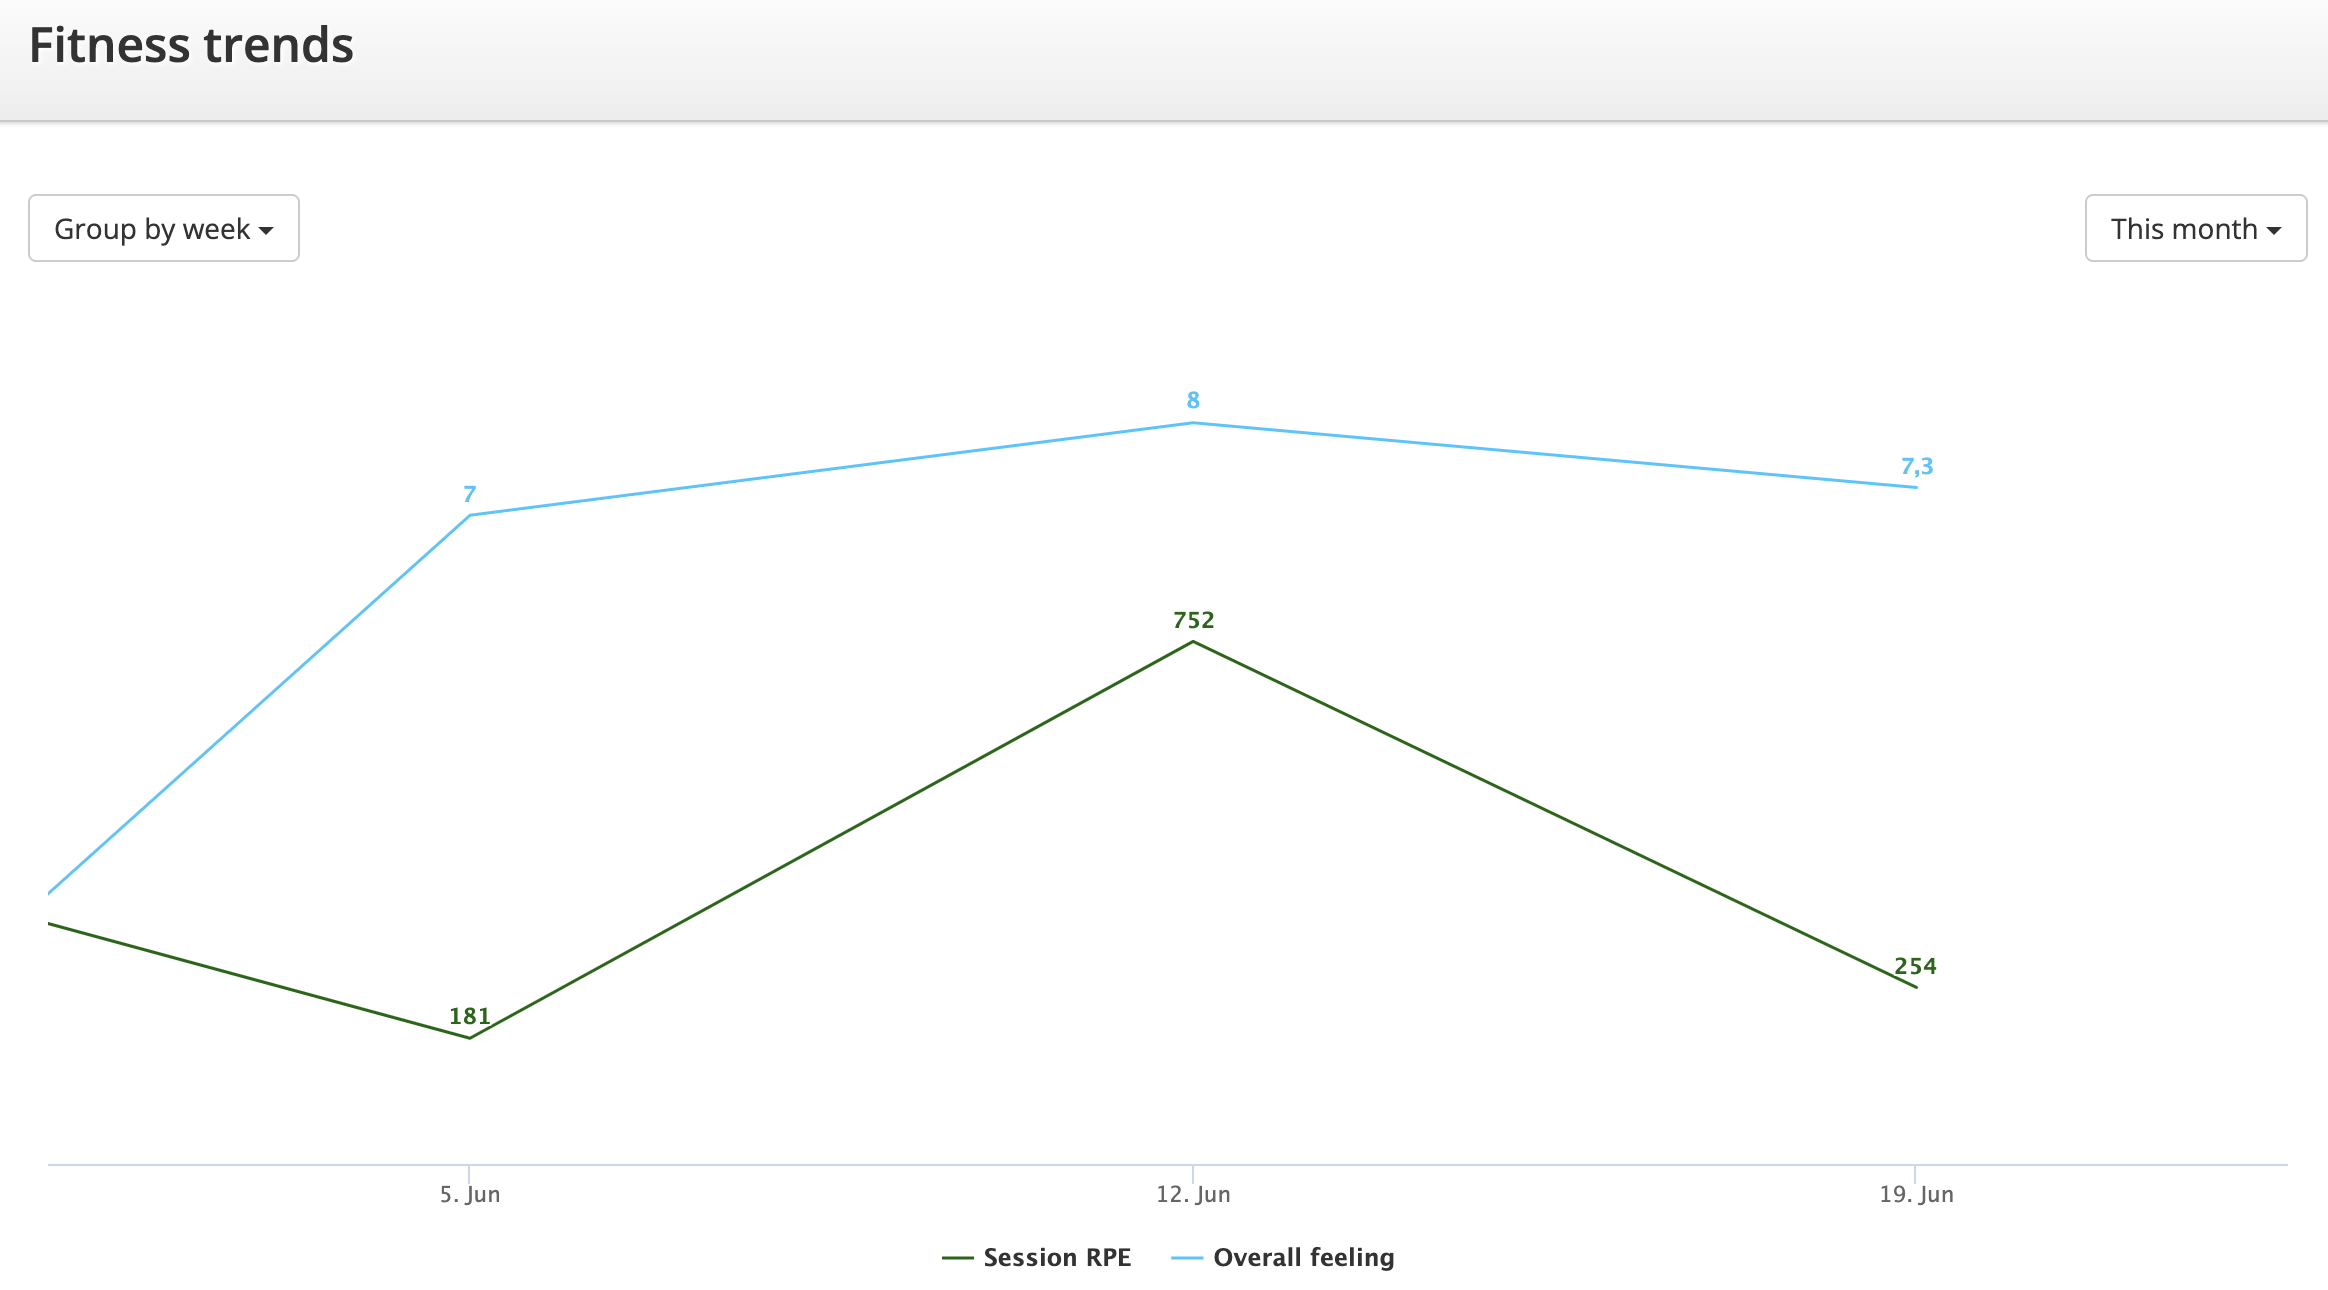
These metrics can be analyzed within the Health section and the Trends section of the Selfloops website. In the Trends section, users have the ability to correlate the Overall Feeling metric with other valuable indicators, such as the Session RPE (Rate of Perceived Exertion).

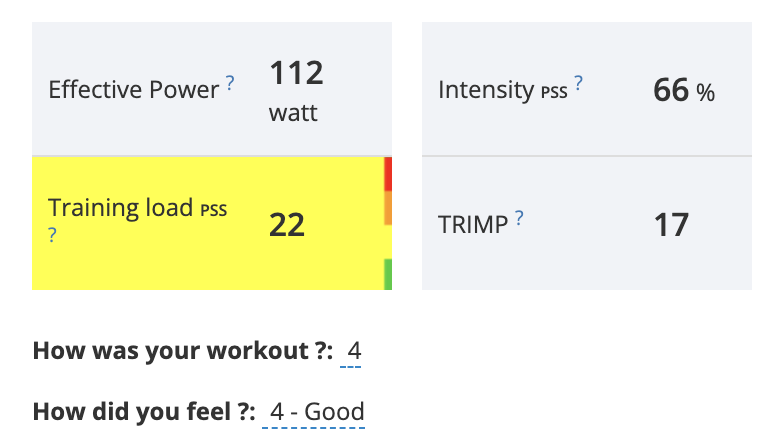
The Overall Feeling metric serves as an expression of an athlete’s mood on a specific day. In addition to this, we have also introduced the “How do you feel?” metric within an activity log, focusing on an athlete’s post-workout experience.

While external load, which can be measured through heart rate monitors and bike power meters, provides insight into an athlete’s physical strain, internal load is gauged through the “How do you feel?” metric and the Rate of Perceived Exertion (RPE).
By integrating sports performance metrics like bike power or heart rate with the feeling/mood metric and RPE, coaches and athletes gain a more comprehensive understanding of an athlete’s overall form and fitness level.
It’s important to recognize that our feelings and mood significantly impact our performance. With the inclusion of these metrics, we offer coaches and athletes an additional tool to effectively track, analyze, and optimize sports performance.