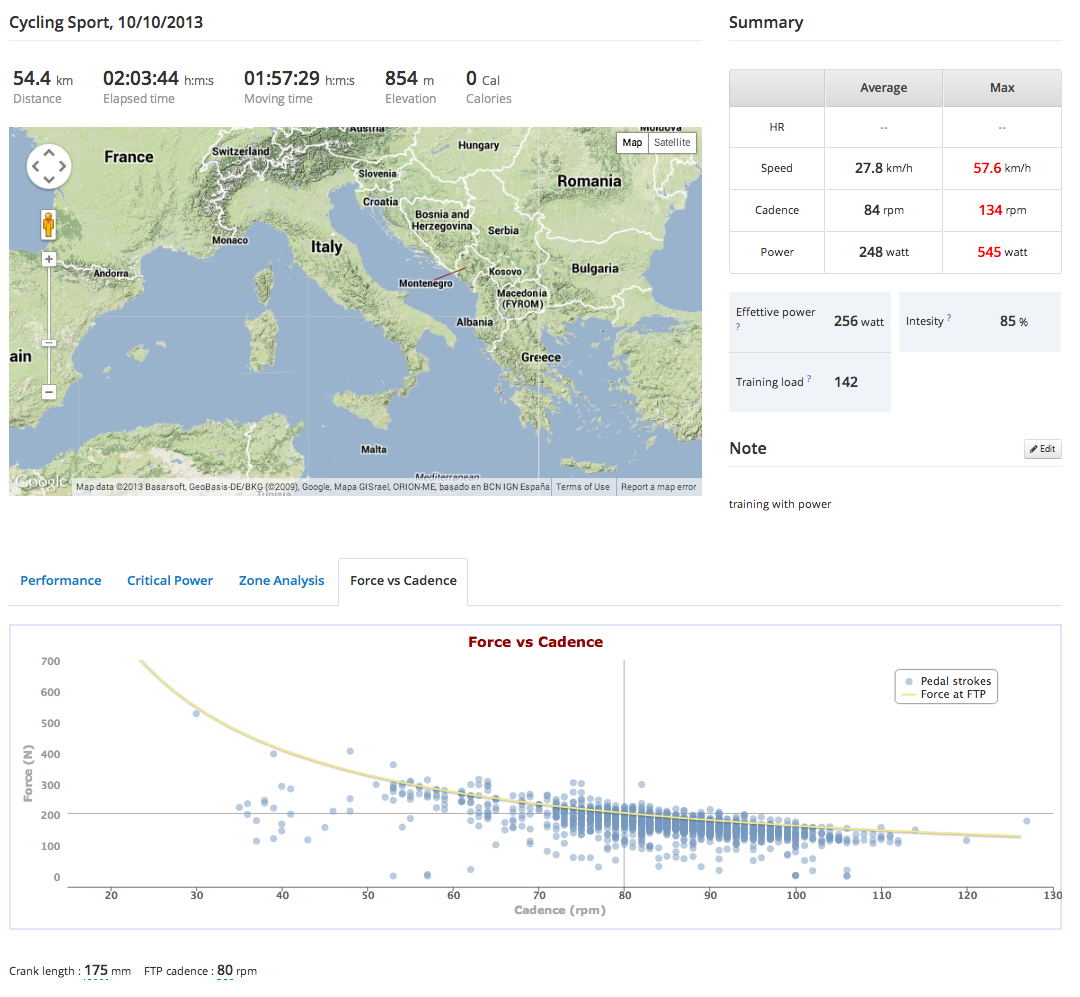
Today we announce the addition of the Force vs Cadence graph to our advanced performance analysis toolbox. You can only improve what you measure (and analyze).
In our performance analysis we have the:
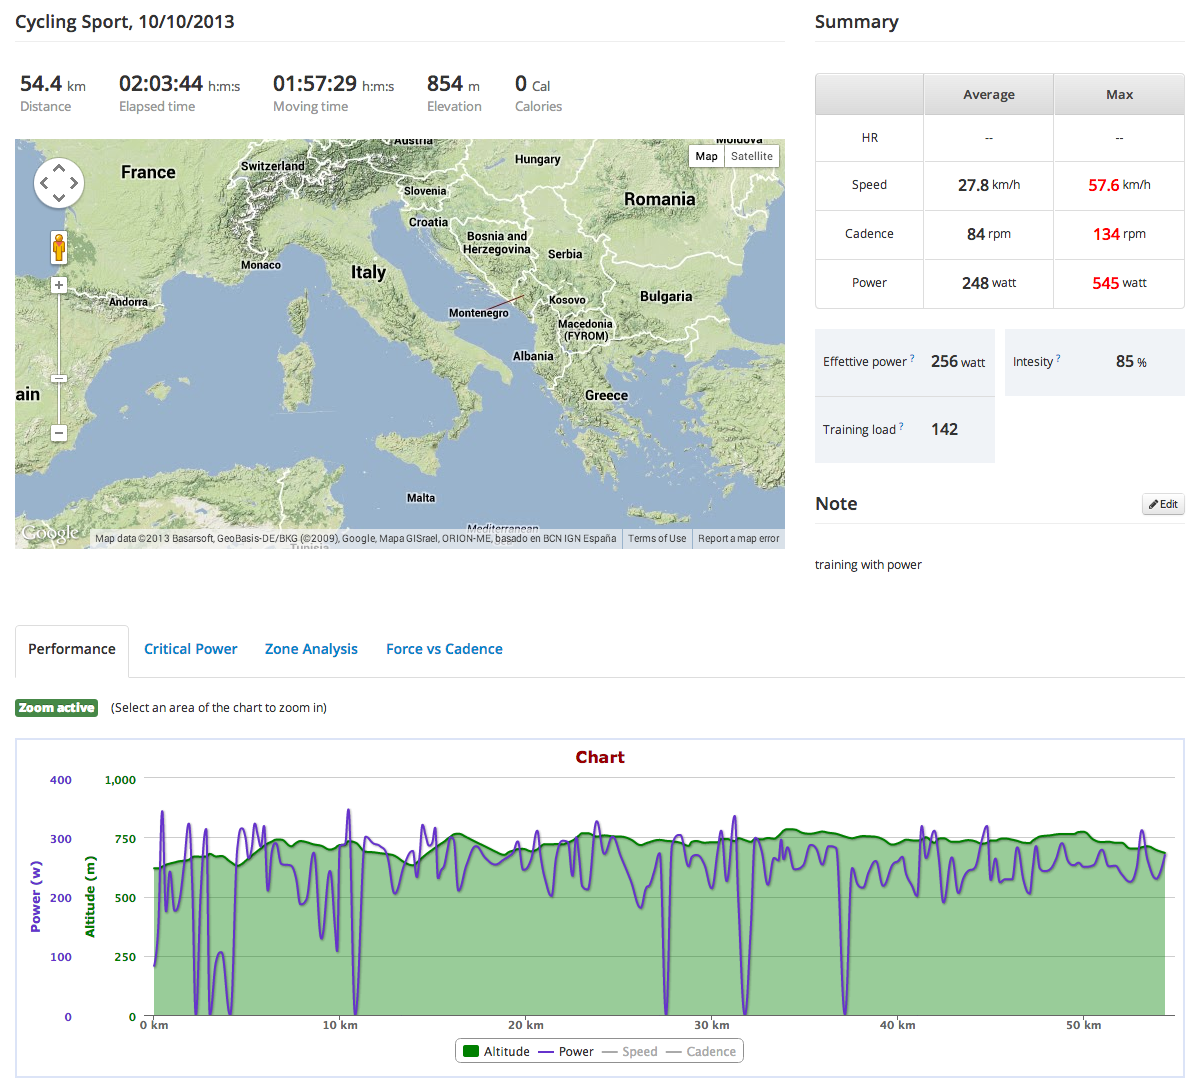
- graph with the map and all the stats (max, averages, and other performance metrics such as TRIMP, Intensity, Effective Power, Training Load)
- Training zones (where you spent the time during your workout)
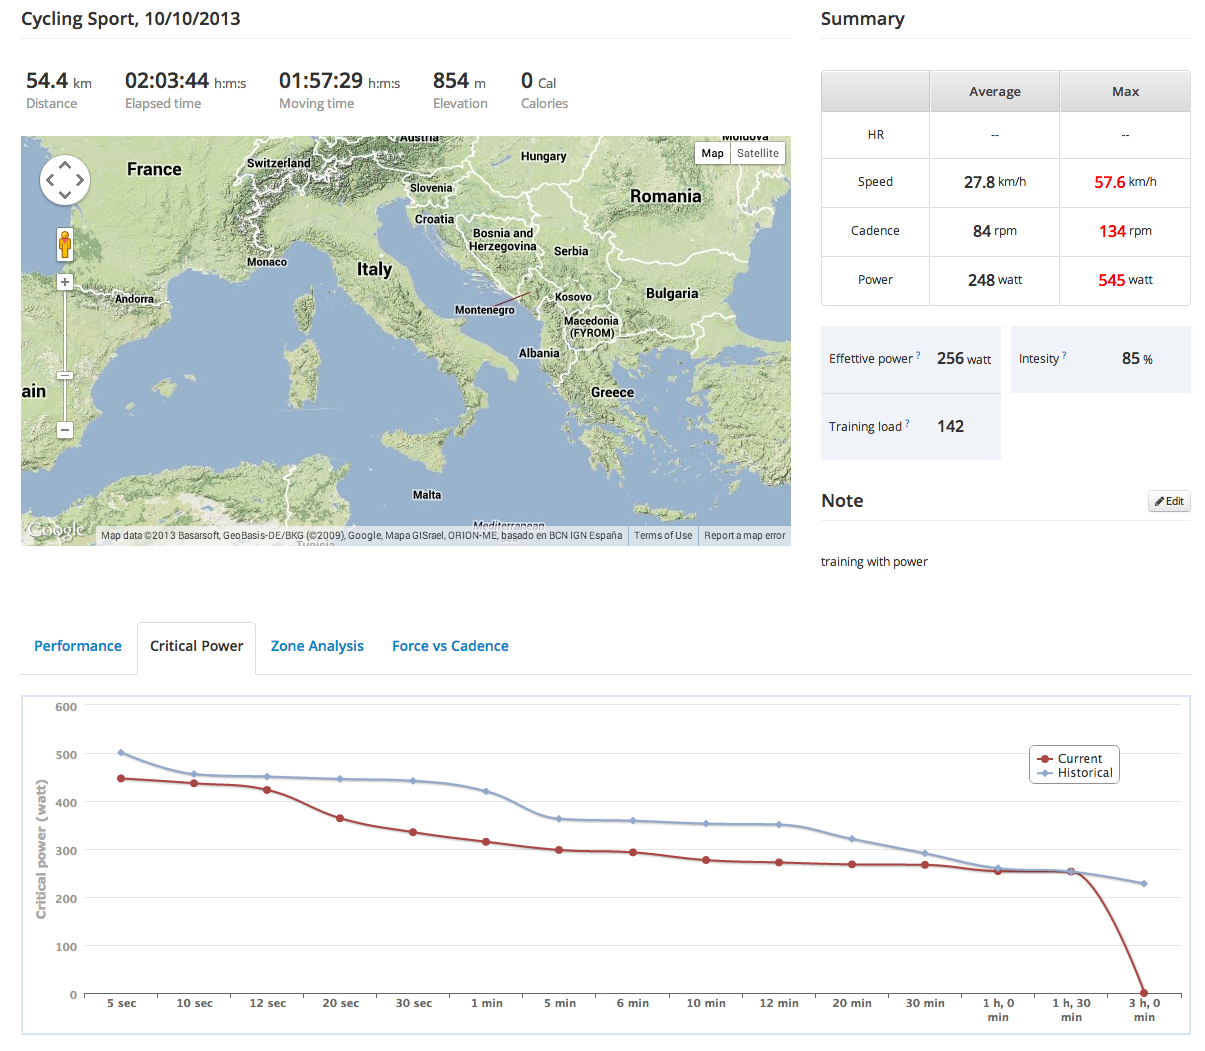
- graph with the current and historical Critical Power
- the Force versus Cadence graph
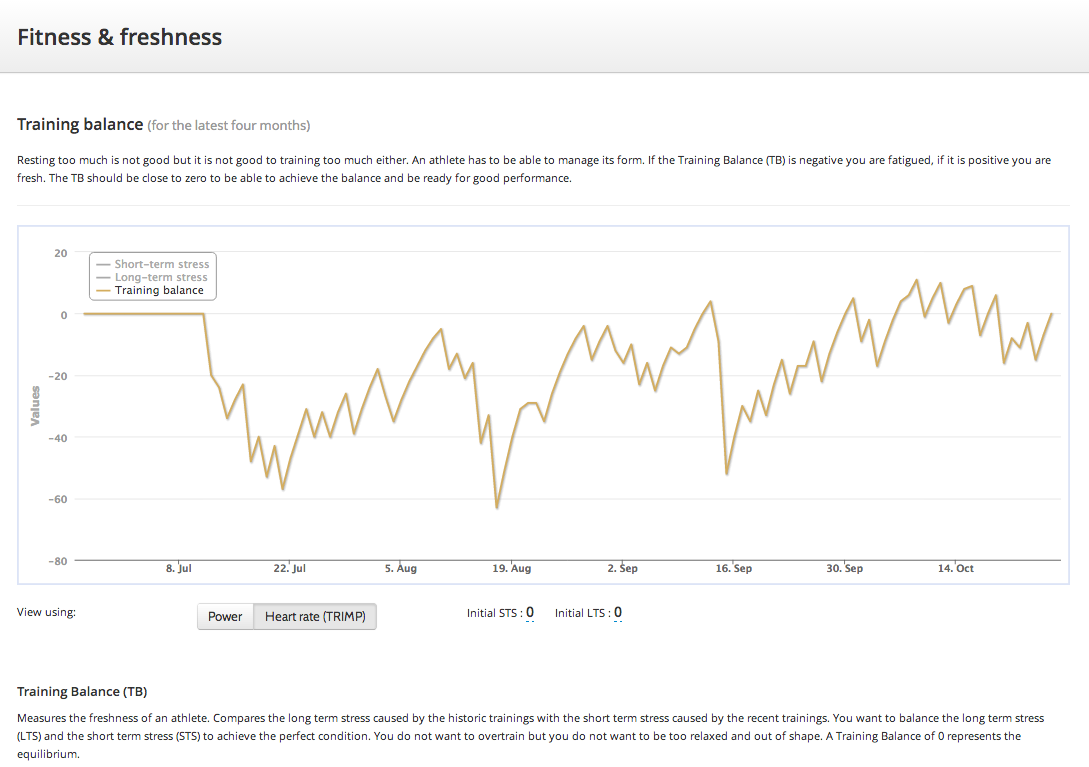
- The Fitness and Freshness graph (measures your form)
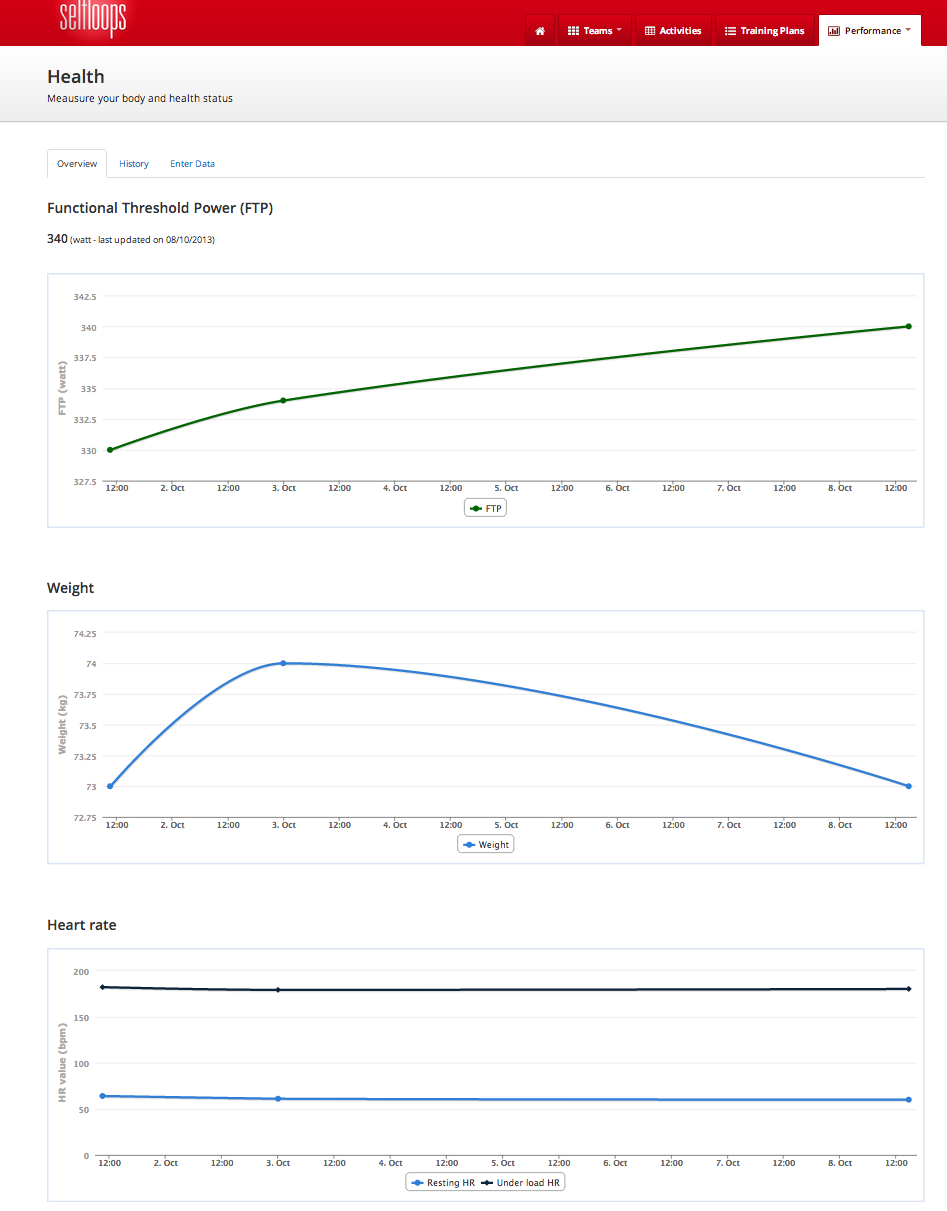
- The Health status with weight, Functional Threshold Power, maximum and at rest heart rate
- Historical Critical Power and Maximum Power Output (W/Kg)
Overall all that you need to analyze your performance and take the steps to improve.
Click to enlarge the images below.