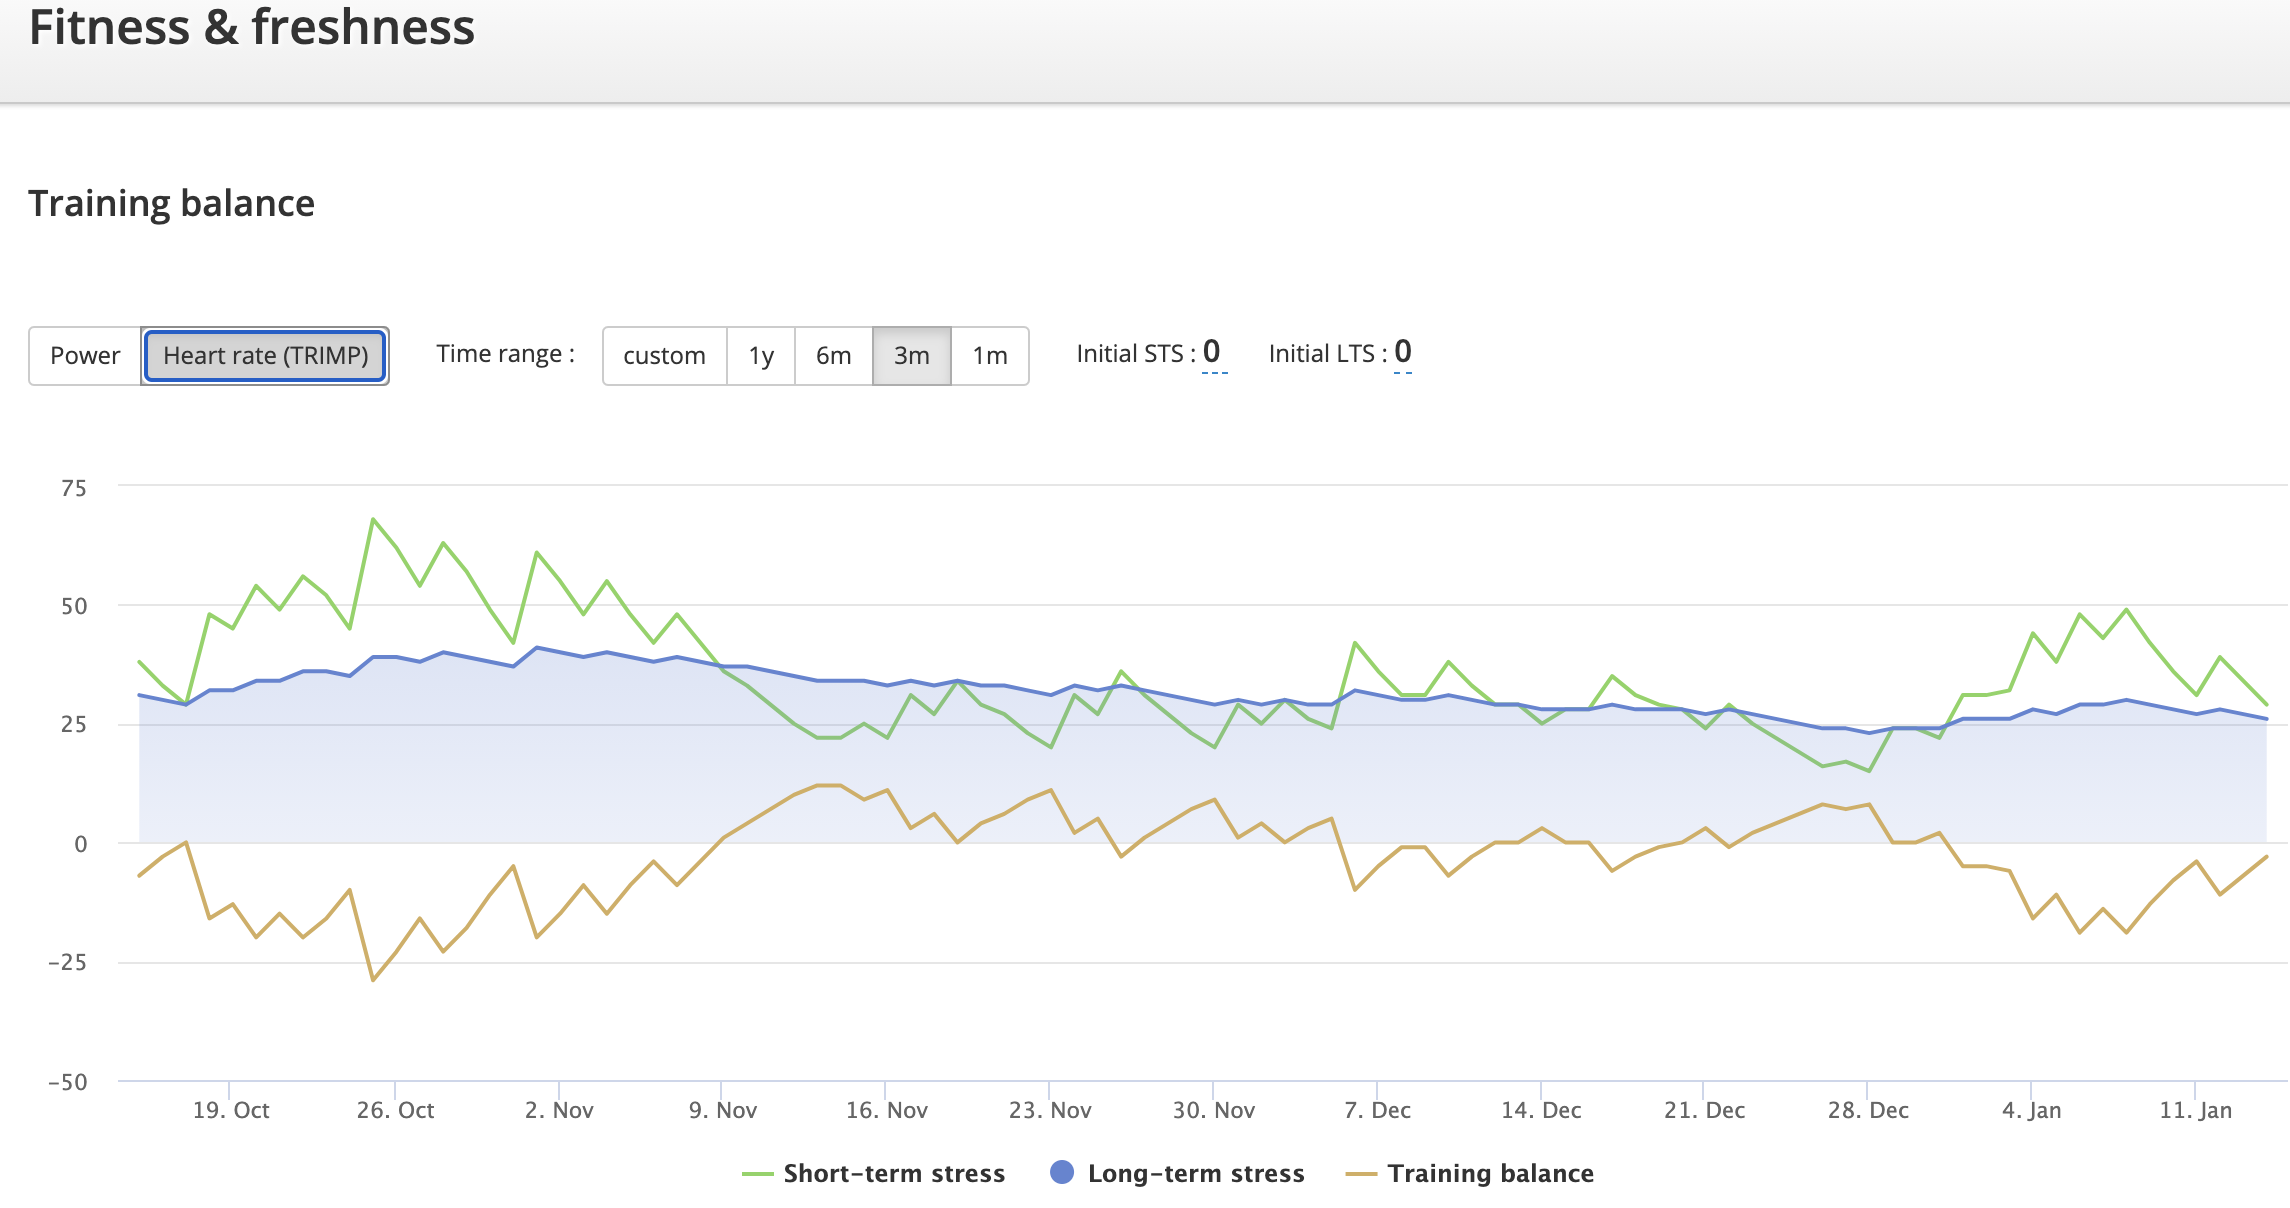
We have just updated the Fitness & Freshness graph with the ability to choose a custom date range. This new feature will allow coaches and athletes to monitor an athlete’s form during a longer period of time, for example, during the entire season, with dates you are free to choose.
The Fitness & Freshness graph is used to monitor an athlete form and physical condition. The input data to the graph is biker power and heart rate data. The training load is measured by the Training Load metric when used with bike power data and by the TRIMP score when the data come from heart rate monitors.
The Training Load and the TRIMP score are metrics that summarise and provide a stress score coming from training. These metrics measure the volume of a certain workout by taking into account the time spent and the bike power and heart rate data.
For athletes, overtraining is a problem as much as not training enough. To improve sports performance we need to stress our body and push our limits. At the same time, too much stress risks to break ourselves with injuries and stress related issues.
A good coach is able to administer and monitor the workout load of the activities in order to push the athletes to better results and outcome. This work requires a delicate act of balance between stress and rest. The Fitness & Freshness graph is one of the tools that allows coaches and athletes to monitor their training load and balance.
Now in Selfloops, with more power.