Announcing lap support and data visualization improvements

We are constantly working to improve our advanced platform for performance analysis. Today we have introduced laps support and improvements on how the graphs show data.

You can now select the lap number and highlight the segment in the graph. For each lap we have calculated several metrics such as duration, elevation, average speed, power and cadence. You can visualize the lap in the map as well.

Screen Shot 2014-01-14 at 2.39.54 PM


Regarding the improvements with the graphs, we have maximized the information visualized at glance. Furthermore, the zoom function allows to show every single data point of the activity, reaching the maximum level of accuracy possible.

Enjoy!


Goals settings versus process

We are starting the new year, making new resolutions and setting our targets.

Are you wondering what metrics to track to evaluate your yearly progresses?

It is probably the case that there could be several metrics, and different objectives each year require different metrics.

However, in terms of supporting goals you establish or new year’s resolutions we’d suggest to focus on metrics that reflect process as opposed to outcome.

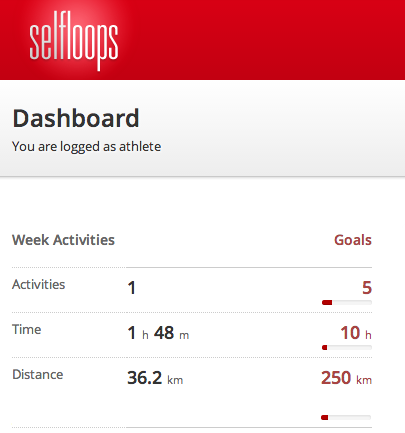
Track the things that are reasonably under your control like weekly hours of training, weekly time in various training levels, number of sessions of a certain type that match your training plan, weekly kj, etc.

That kind of stuff usually comes down to putting in the time and the effort. Not always of course as we have to allow for getting sick or life’s interruptions but we have far more control over the effort we put in than the results those efforts produce so we’d avoid goals like ‘raising my FTP to 400 watts’ or things like that unless you have very good reason to believe those goals are attainable based on previous history but still it’ll be the process goals that take you towards any outcome goals.

You can improve what you measure! Have a great 2014.

Are you ready to start strong in 2014?

First of all Merry Christmas and Happy New Year!

Are you ready to start strong in 2014? We have a lot of news to share with you.

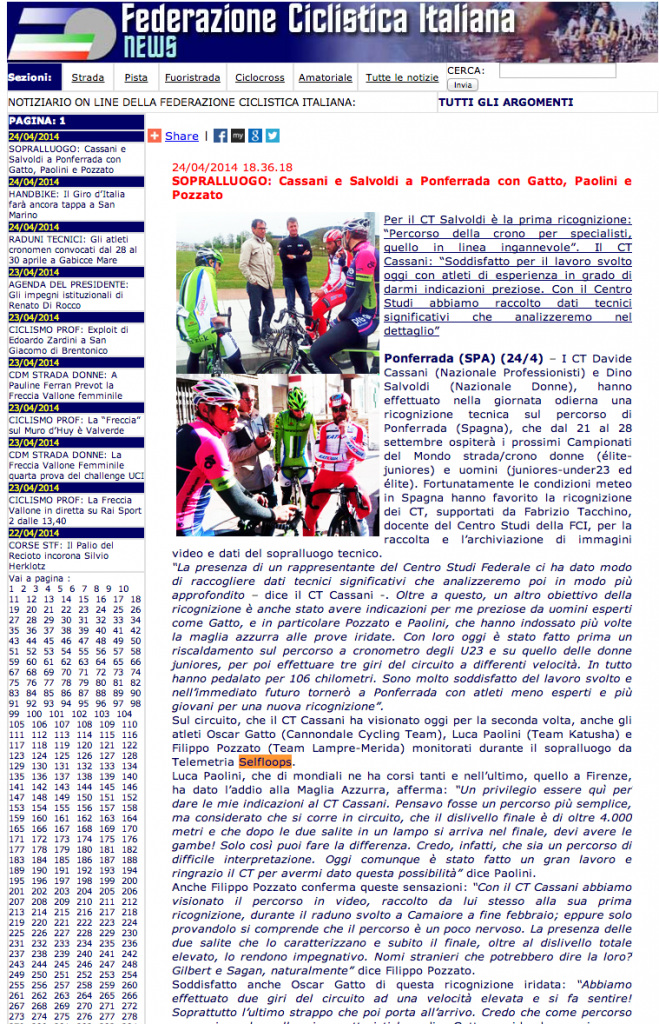
Pro teams choose SelfLoops
The Androni Giocattoli Venezuela uses SelfLoops to manage the team performance.

androni

SelfLoops Group Fitness 
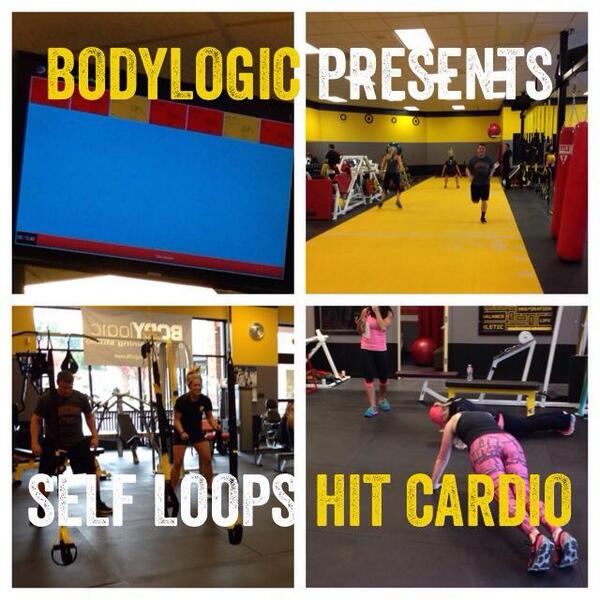
With the SelfLoops Group Fitness solution you can monitor indoor sessions and cardio workouts. This service is successfully used around the world by personal trainers, gyms and in training events.
Now we have created the SelfLoops Group Power, to monitor bike power sensors in indoor group sessions. For people that are serious about performance!

banner-power


You can only improve what you measure
We are constantly improving our platform. We have added metrics to track your performance and fitness form. Coaches can manage the team calendar, monitor the athletes performance, create training plans, write  race reports. Only 45€/year! Sign up at our website (1 month free trial).

Screen Shot 2013-10-26 at 10.37.17 AM


Telemetry
Stream your trainings in real-time, with the SelfLoops telemetry. It can be used both indoor and outdoor. And you can stream single or group of athletes at the same time. Make your trainings and events more entertaining. Measure your aerodynamics. Read more about it at our website.


velodrome

The SelfLoops store
To track your activities you need devices and tools, you can find them at our store.

If you want to enable ANT+ in your Android device to connect to heart rate monitors, bike cadence and speed sensors, bike power sensors read our how-to tech guide.

Advanced Performance Analysis by SelfLoops

Today we announce the addition of the Force vs Cadence graph to our advanced performance analysis toolbox.  You can only improve what you measure (and analyze).

In our performance analysis we have the:

  • graph with the map and all the stats (max, averages, and other performance metrics such as TRIMP, Intensity, Effective Power, Training Load)
  • Training zones (where you spent the time during your workout)
  • graph with the current and historical Critical Power
  • the Force versus Cadence graph
  • The Fitness and Freshness graph (measures your form)
  • The Health status with weight, Functional Threshold Power, maximum and at rest heart rate
  • Historical Critical Power and Maximum Power Output (W/Kg)
Overall all that you need to analyze your performance and take the steps to improve.

Click to enlarge the images below.