Back in October 2014, we launched the SELFLOOPS HRV app with a clear mission: bring professional-grade heart rate variability analysis to athletes and coaches everywhere.
Over the years, the app has been continuously improved. But this release is different.
This is a complete redesign—not just in how the app looks, but in how it helps you understand your body and train smarter.
A Fresh, Simpler Experience
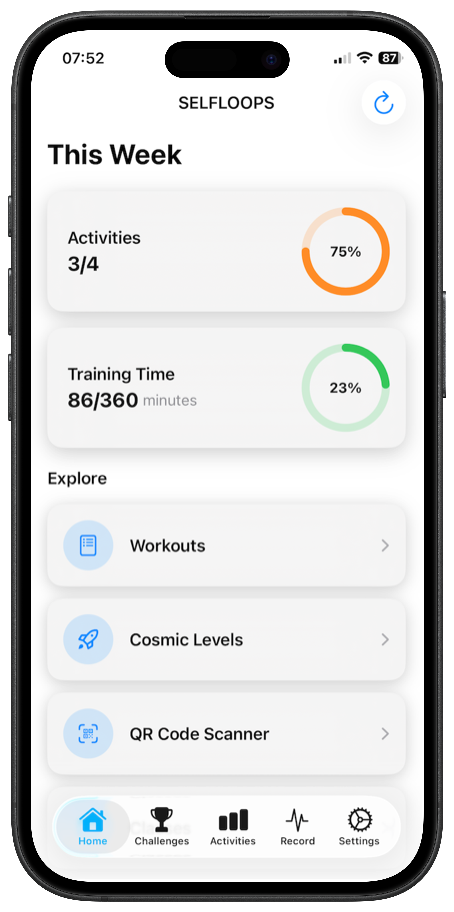
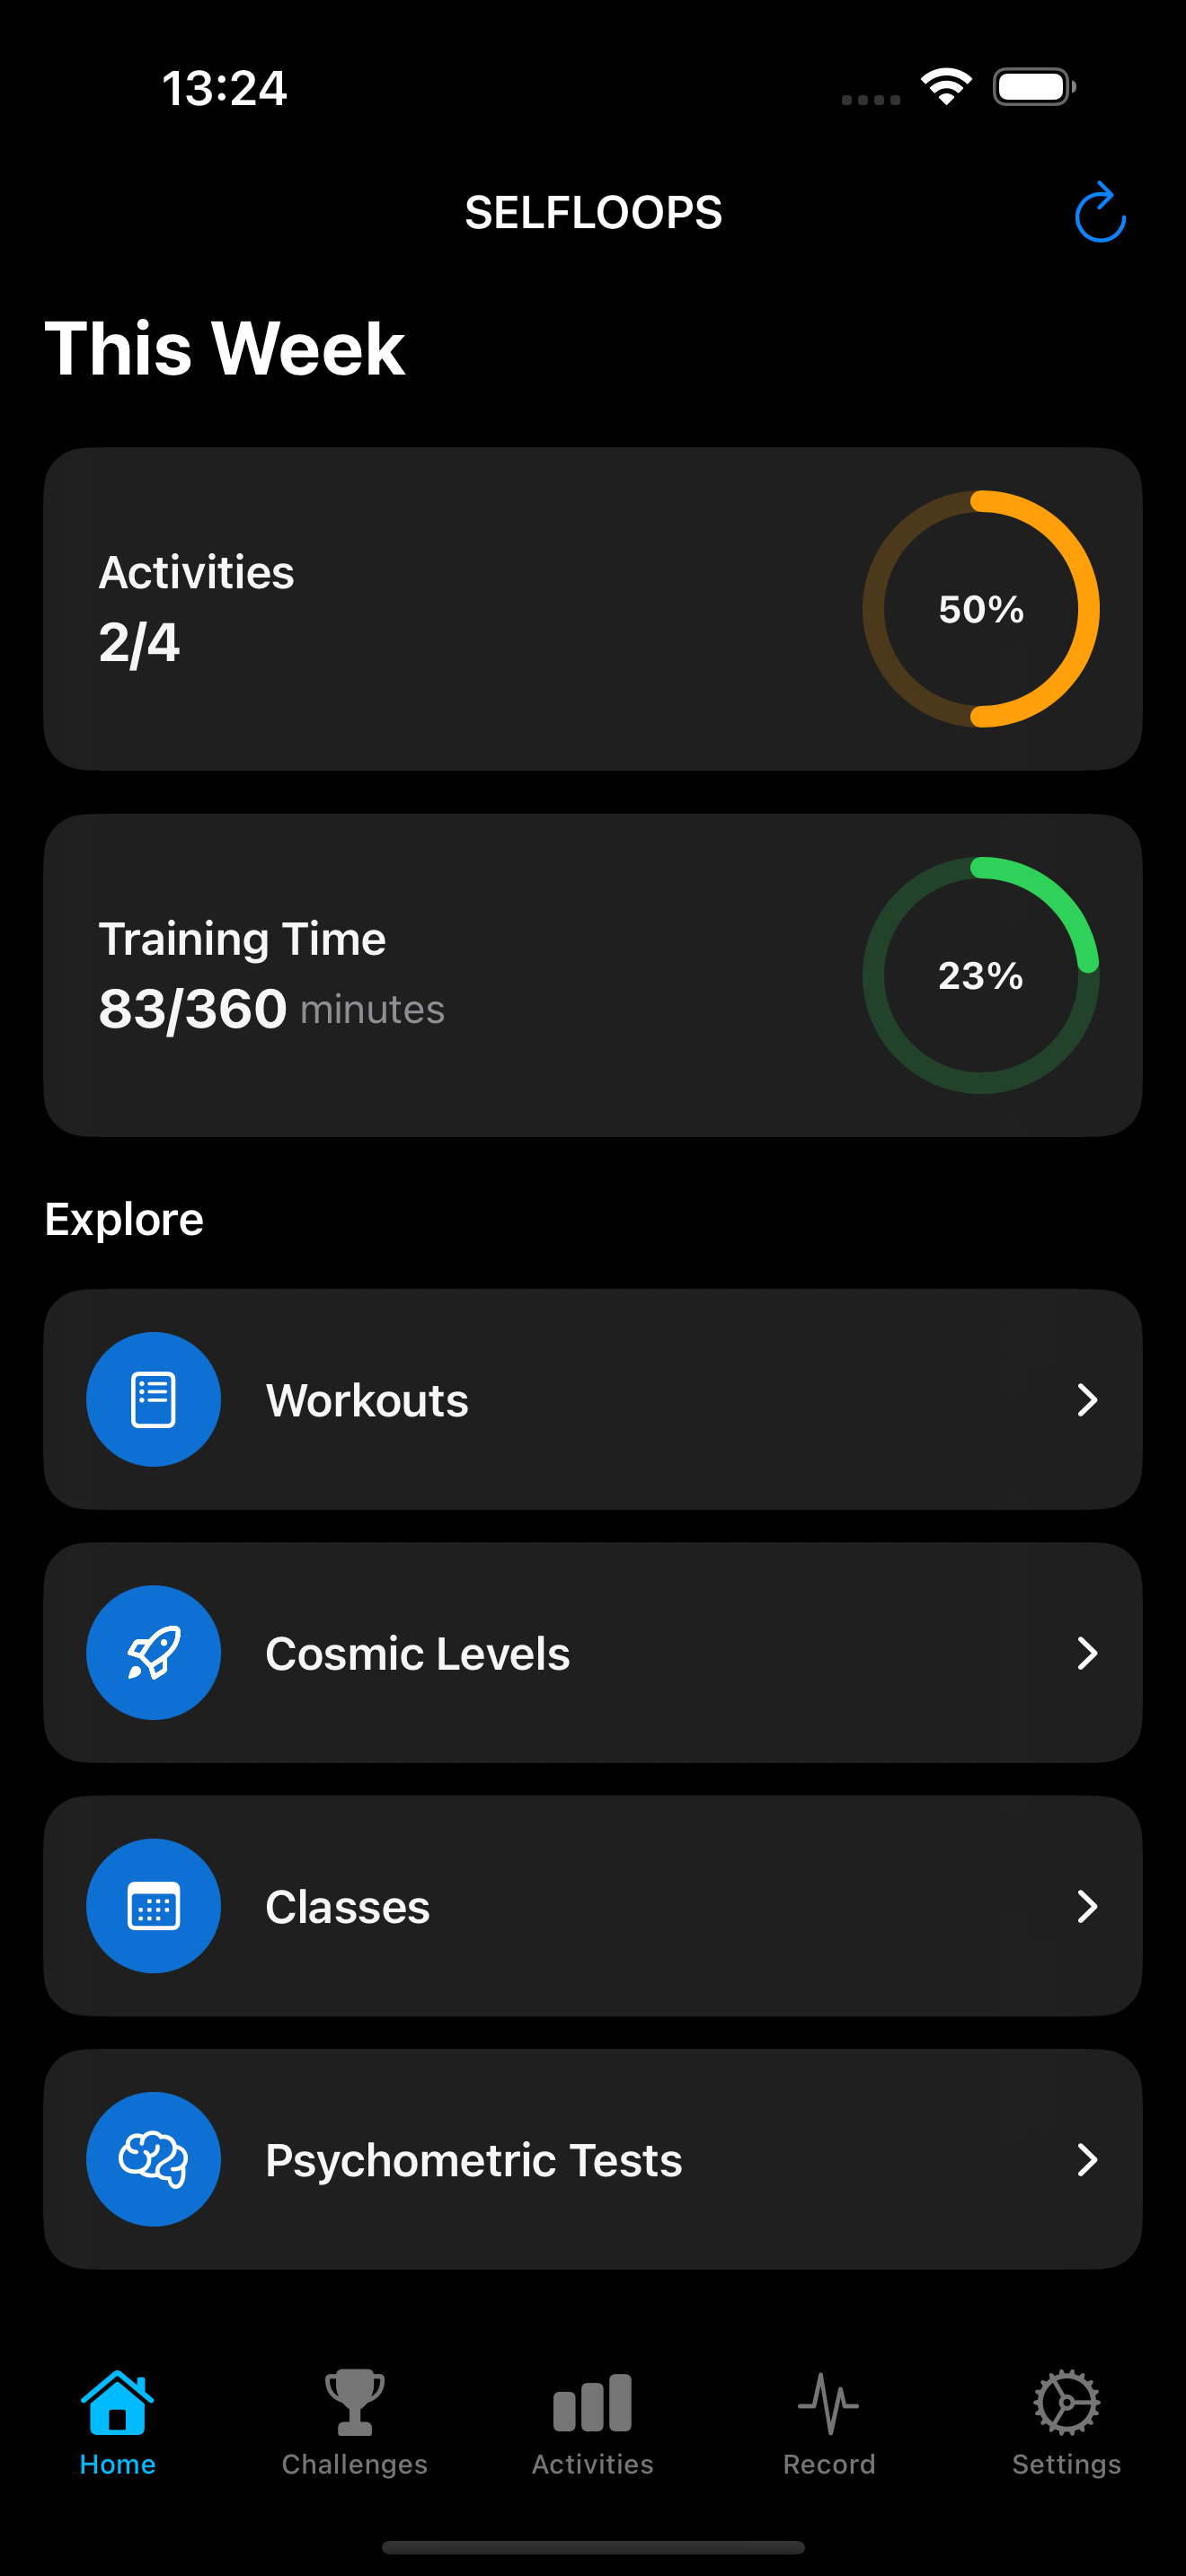
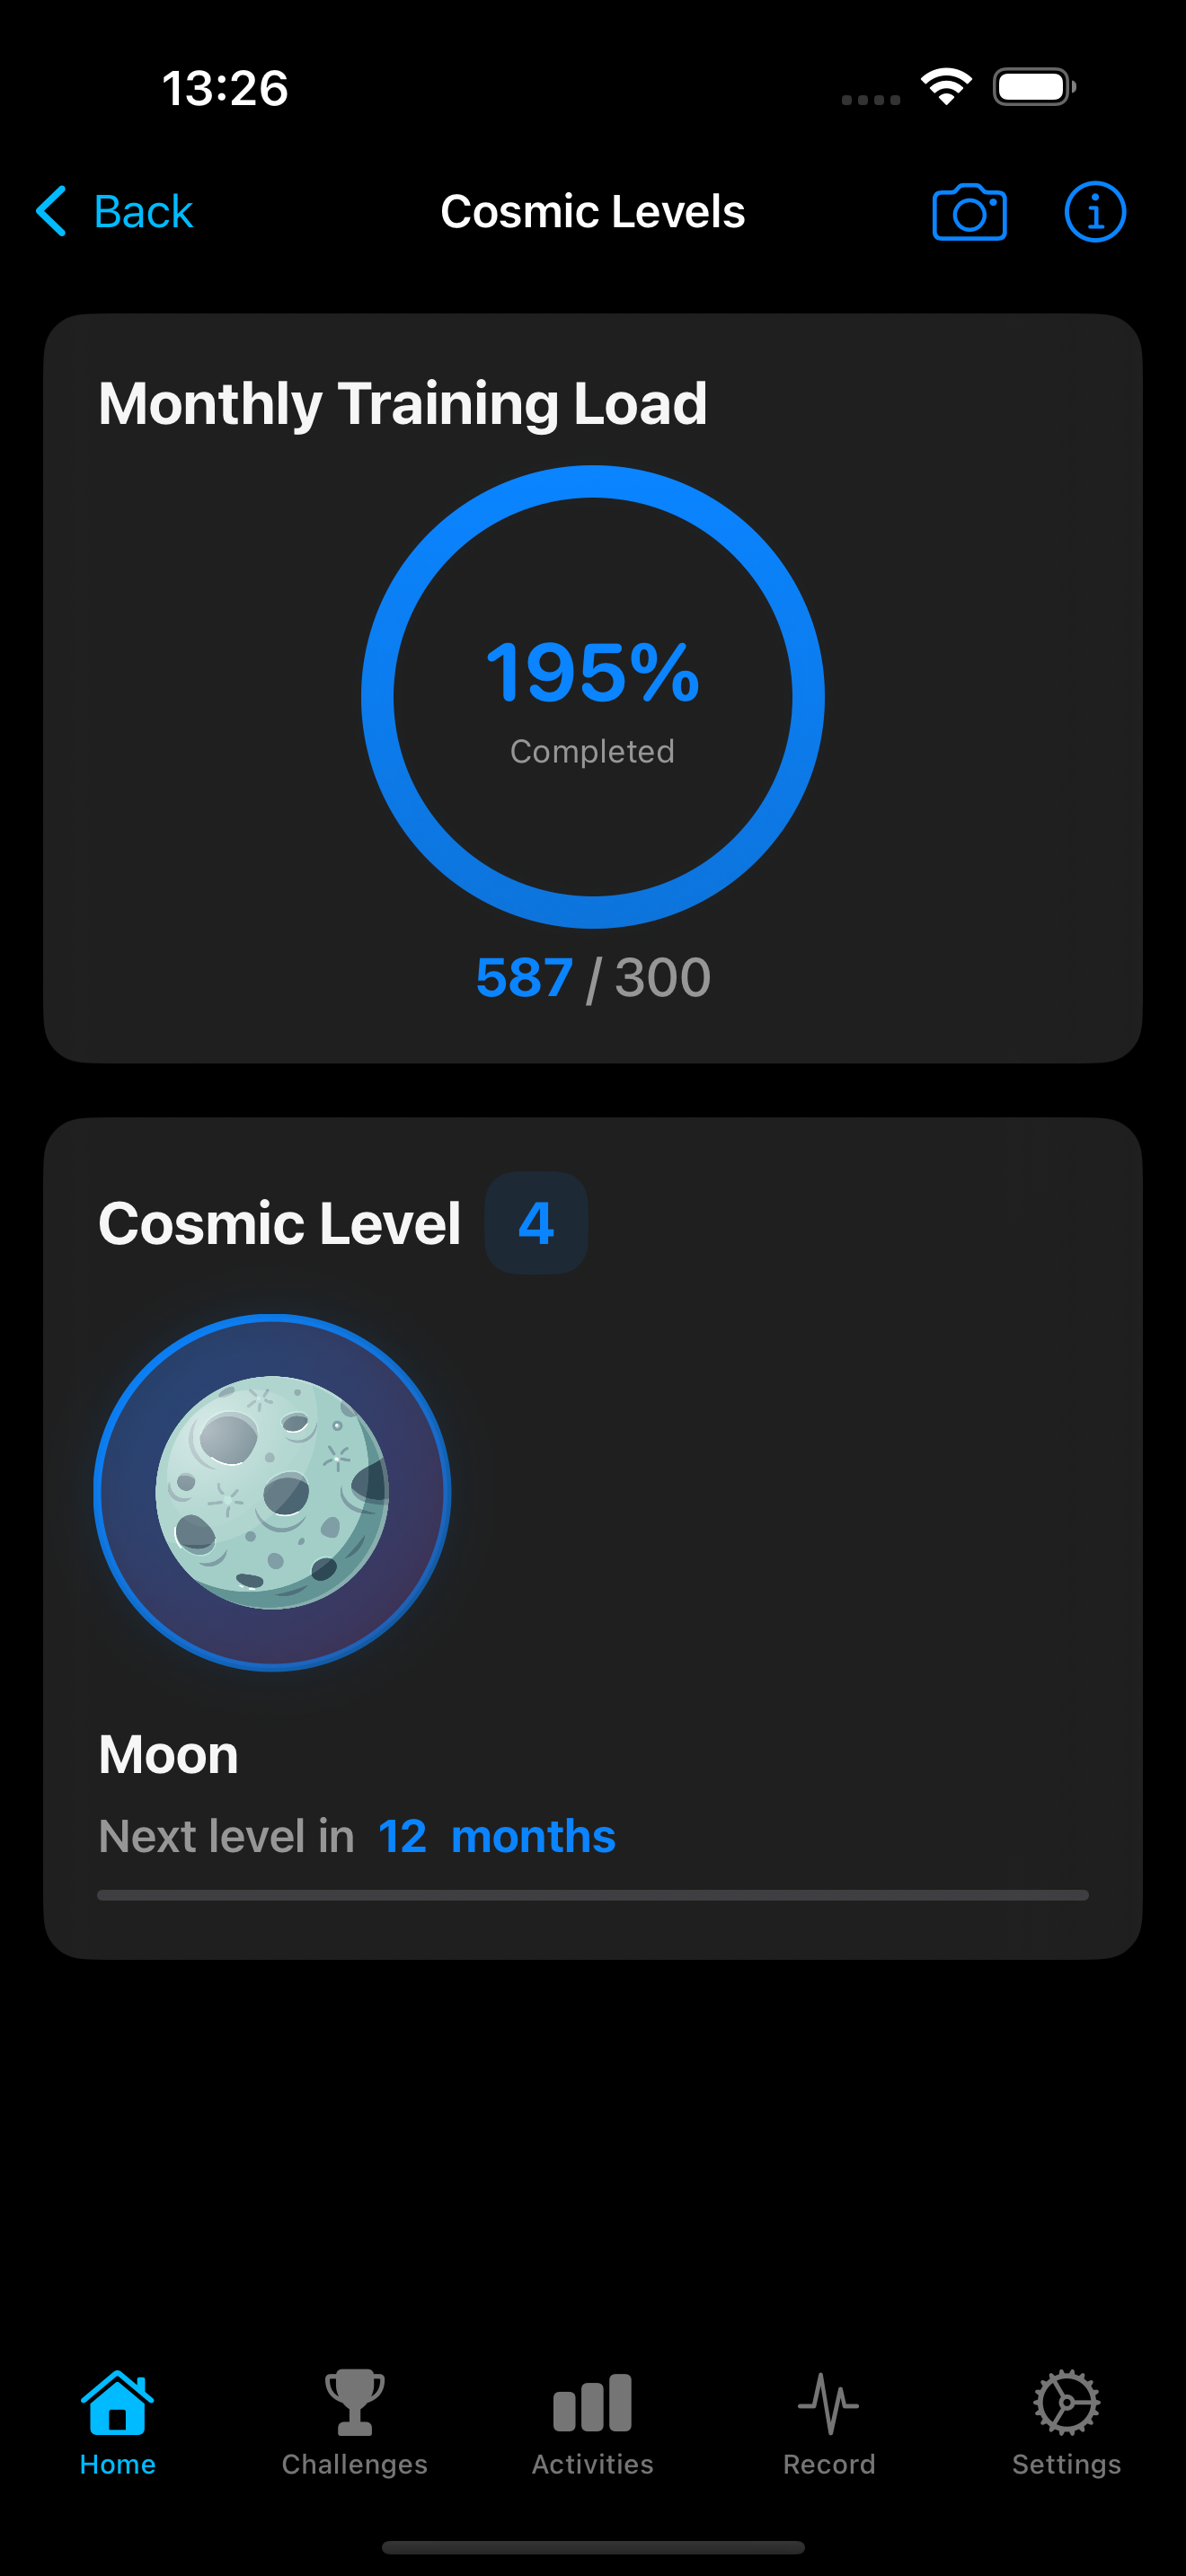
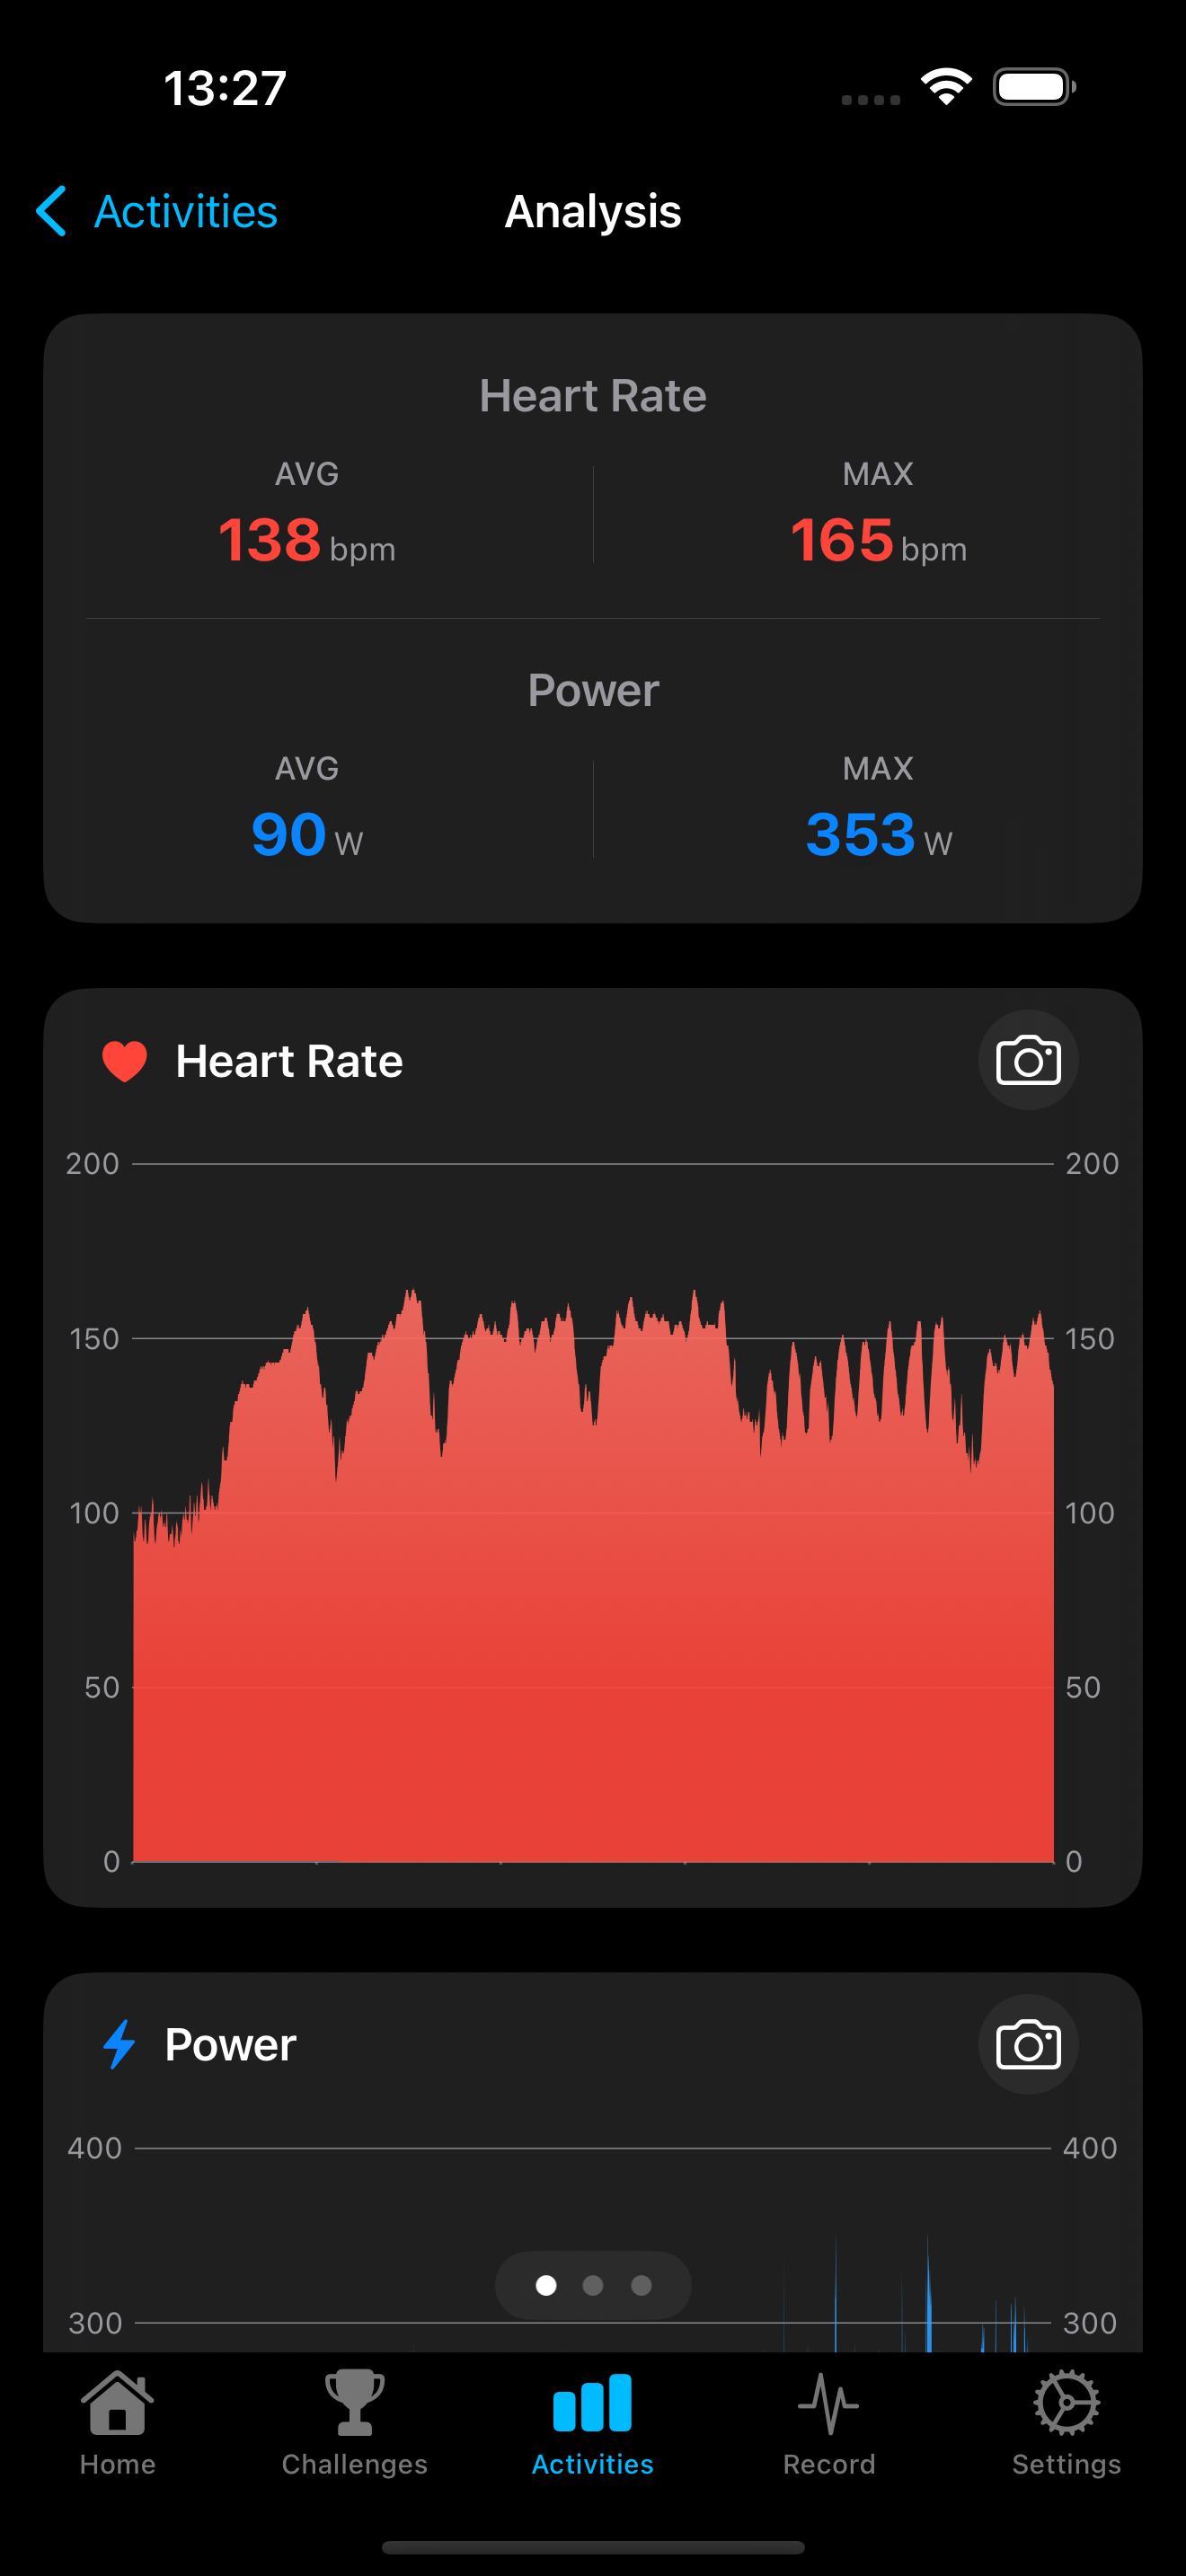
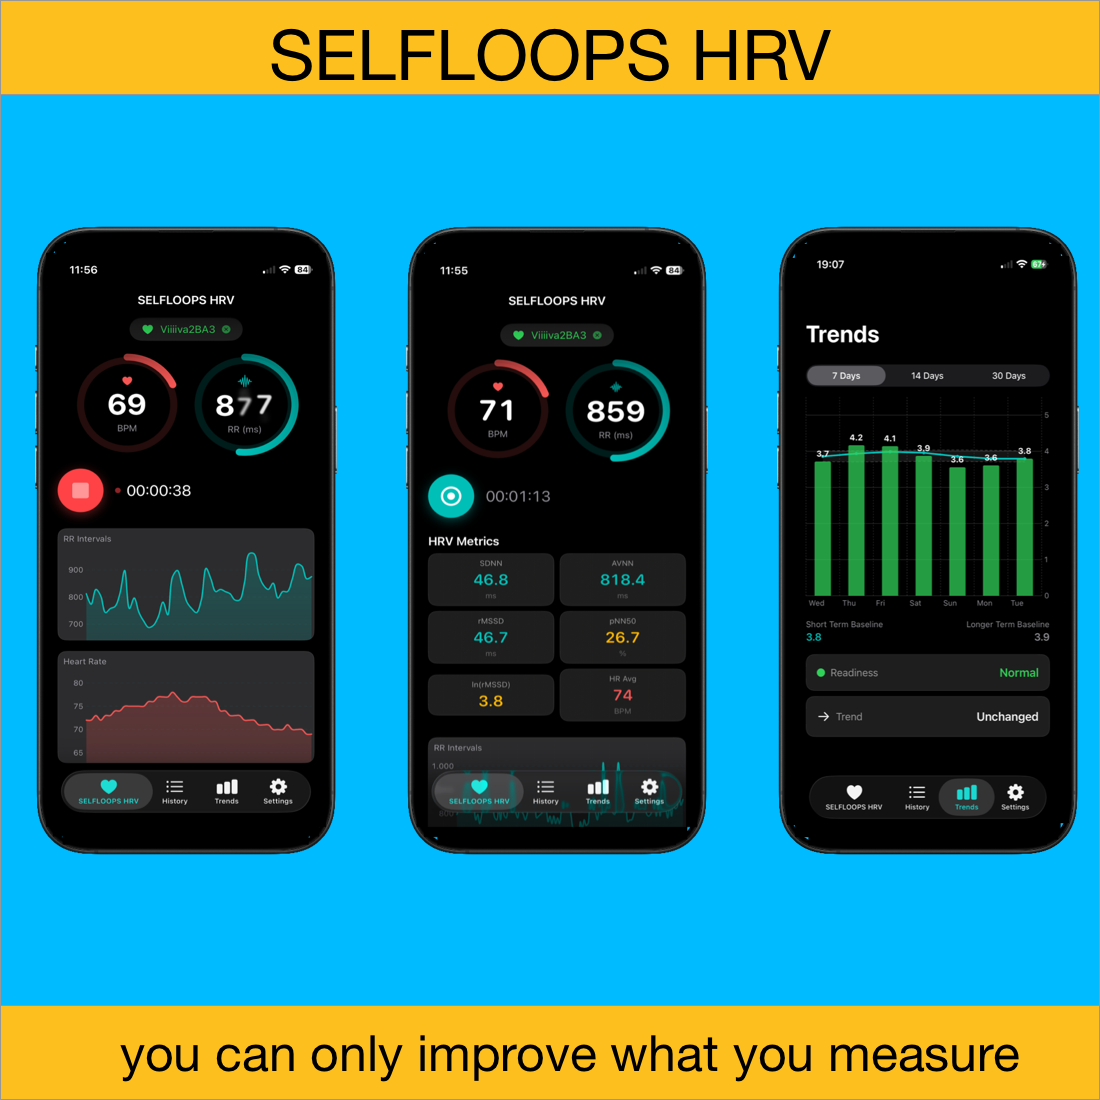
The first thing you’ll notice is the new interface. It’s cleaner, faster, and built to make complex data easy to understand.
Your key metrics are now easier to read at a glance, and navigating the app feels more natural. Whether you’re checking your recovery in the morning or reviewing past sessions, everything is designed to be quick and intuitive.
Accuracy You Can Trust
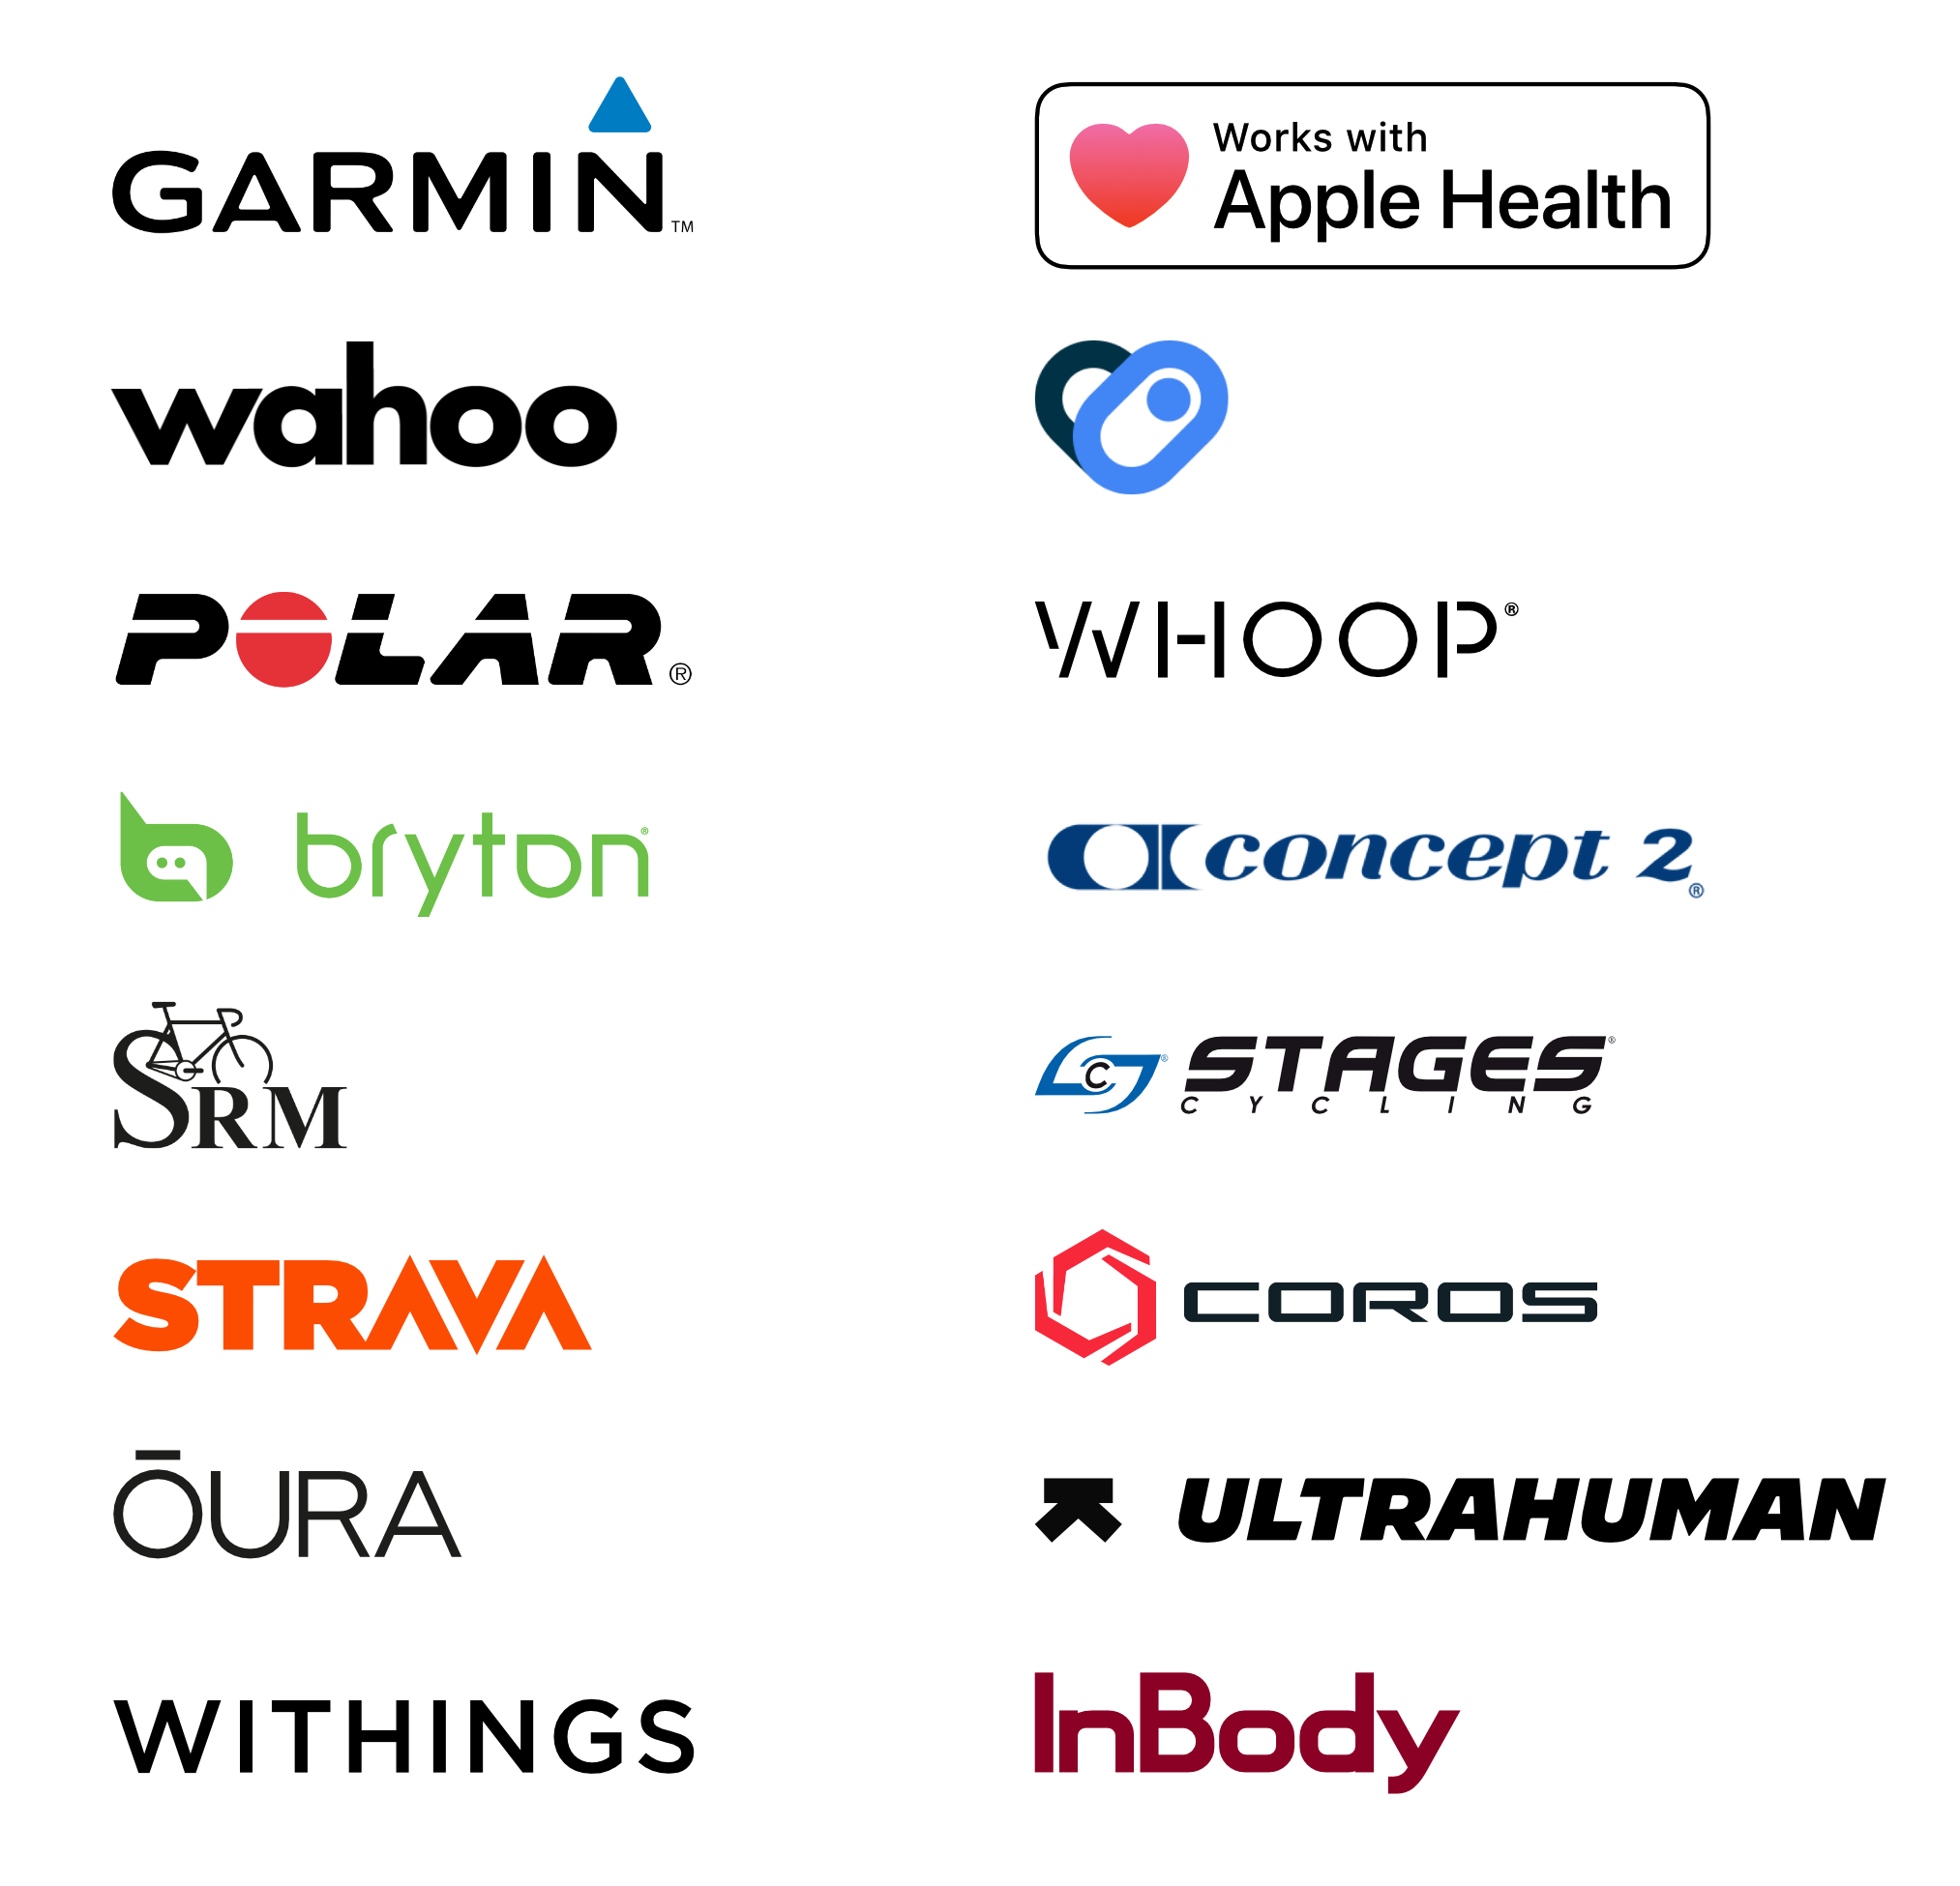
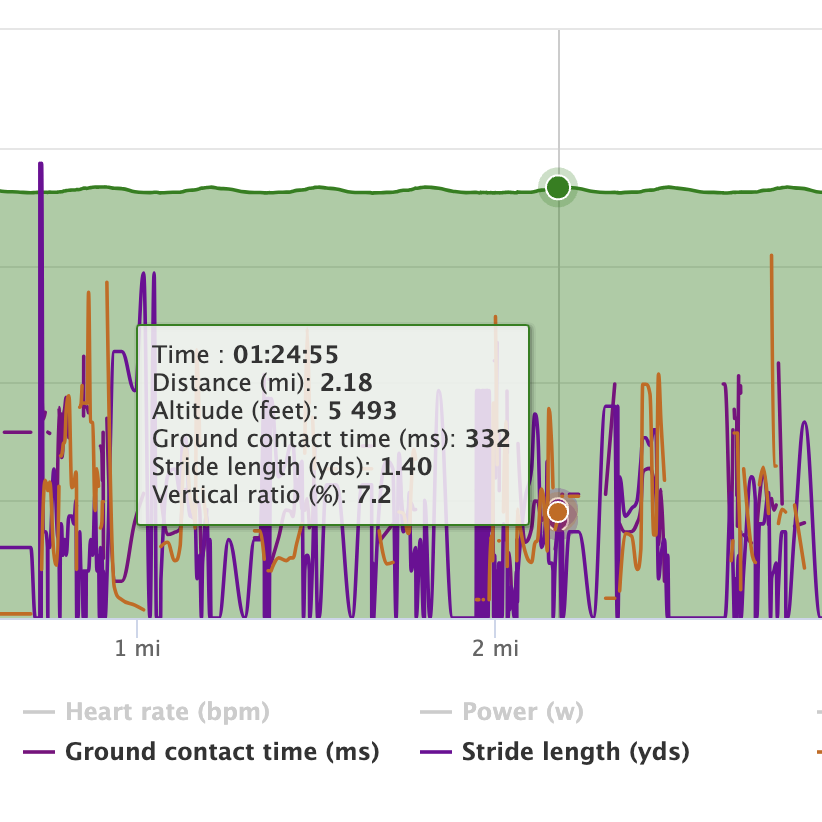
SELFLOOPS HRV has always focused on accuracy, using precise beat-to-beat (R-R interval) data from Bluetooth heart rate monitors.
With this update, we’ve taken it a step further. Improved analysis and error correction bring the app closer than ever to state-of-the-art, professional-level accuracy—the kind trusted in elite sports and research.
This is not just a visual update. It’s a step forward in how physiological data can be used to support real-world performance decisions—for athletes, coaches, and organizations alike.
What’s new in the refresh:
→ Completely rebuilt interface — faster, cleaner, focused on your morning check-in
→ Trends analysis that shows your HRV trajectory over days and weeks
→ A Readiness Score that tells you when to push and when to recover
→ Full scientific metrics: RMSSD, ln(RMSSD), SDNN, pNN50, AVNN
The application can import R–R interval data from Apple Watch, as well as from any app that writes this data to HealthKit via the HealthKit API.
The Apple Watch automatically records R–R intervals throughout the day, but you can also trigger a dedicated HRV measurement using the Breathe app (now part of the Mindfulness app), which forces the watch to record and store R–R interval data in HealthKit. Once recorded, this session can be imported into the SELFLOOPS HRV app.
New: Trends & Readiness Score
One of the biggest additions is the introduction of Trends Analysis with the Readiness Score.
Instead of isolated data points, we now translate HRV into something actionable:
• Are you ready to perform?
• Are you accumulating fatigue?
• Are you improving over time?
This shift—from raw data to decision-support—is where we see the real value emerging. The app now looks at how your HRV evolves over time and turns that into a simple, actionable insight.
In practice, it’s straightforward:
• Measure your HRV daily, ideally in the morning
• Watch how your trend develops over time
• Use the Readiness Score to guide your training
When your readiness is high, it’s a good time to push. When it drops, your body may need recovery. It’s a smarter, more consistent way to train—based on how you actually feel, not just what’s planned.
Moving Forward
This redesign marks an important step forward for SELFLOOPS HRV. It’s faster, clearer, and more powerful—but still built around the same core idea: giving you reliable insights you can actually use.
Whether you’re a cyclist, runner, coach, or researcher — this is the tool that gives you an honest, accurate picture of your recovery and training readiness. No gimmicks, just data you can trust.
Available on the App Store and Google Play Store.
12 years later, we’re just getting started.