We are happy to announce that we have included the support for Moxy.
Moxy is an innovative device that uses infrared light to continuously monitor oxygen saturation (SmO₂) levels in the muscles of athletes while they exercise.
Oxygen is the fuel that drives the muscle, and Muscle Oxygen levels are constantly changing.
Moxy is used to assess athletes, guide their training, and hone their performance during competition. It helps identify optimal training intensity zones and provides feedback on the physiologic systems limiting performance.
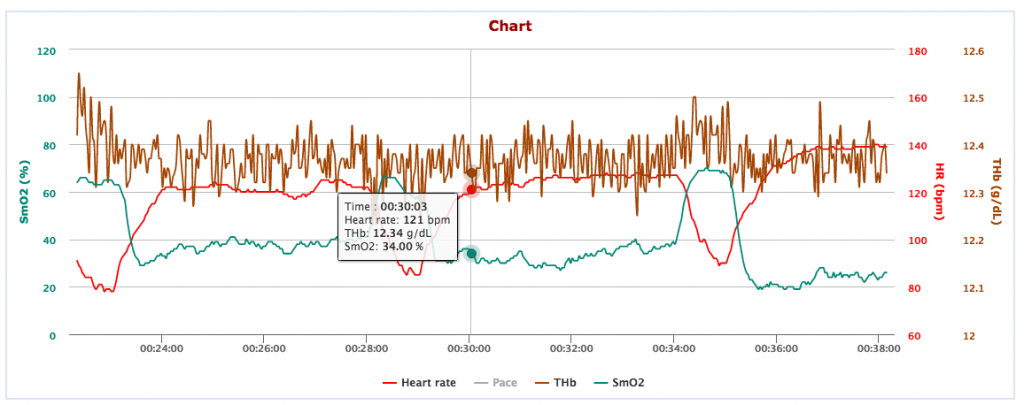
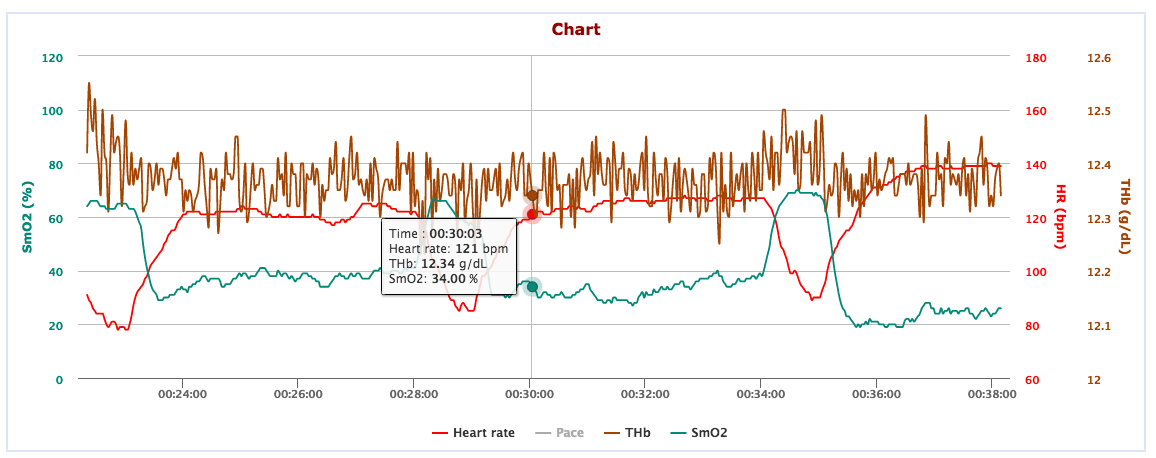
Now with SelfLoops you can analyze how the Total Hemoglobin Concentration (THb measured in g/dL) and the Percentage of hemoglobin saturated with oxygen (Smo2 %) vary while exercising.
These are additional metrics that can be used to evaluate and measure your trainings.
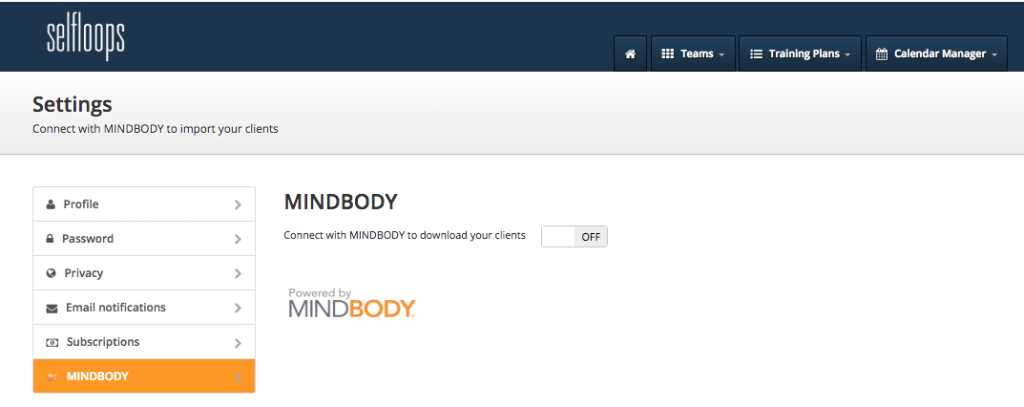
Since Moxy conforms to the ANT+ Muscle Oxygen profile, we have added this profile to our indoor bike power training service. Basically, train with our app, automatically upload your data on SelfLoops and get all the analysis on your workout, including THb and and Smo2, on the SelfLoops website.
You can only improve what you measure!