Unlocking Performance: New Running Metrics Now Available on SELFLOOPS

At SELFLOOPS, we are committed to providing athletes and coaches with cutting-edge tools to analyze and improve sports performance. We are excited to introduce a new set of Running Metrics to our platform, offering deeper insights into running efficiency and biomechanics. These metrics are essential for runners of all levels, from beginners looking to refine their technique to elite athletes aiming for peak performance.

Why Running Metrics Matter

Running is not just about speed and endurance; efficiency and technique play a crucial role in performance and injury prevention. By tracking detailed running metrics, coaches and athletes can identify areas of improvement, fine-tune running form, and make data-driven training adjustments.

The new Running Metrics now available on SELFLOOPS include:

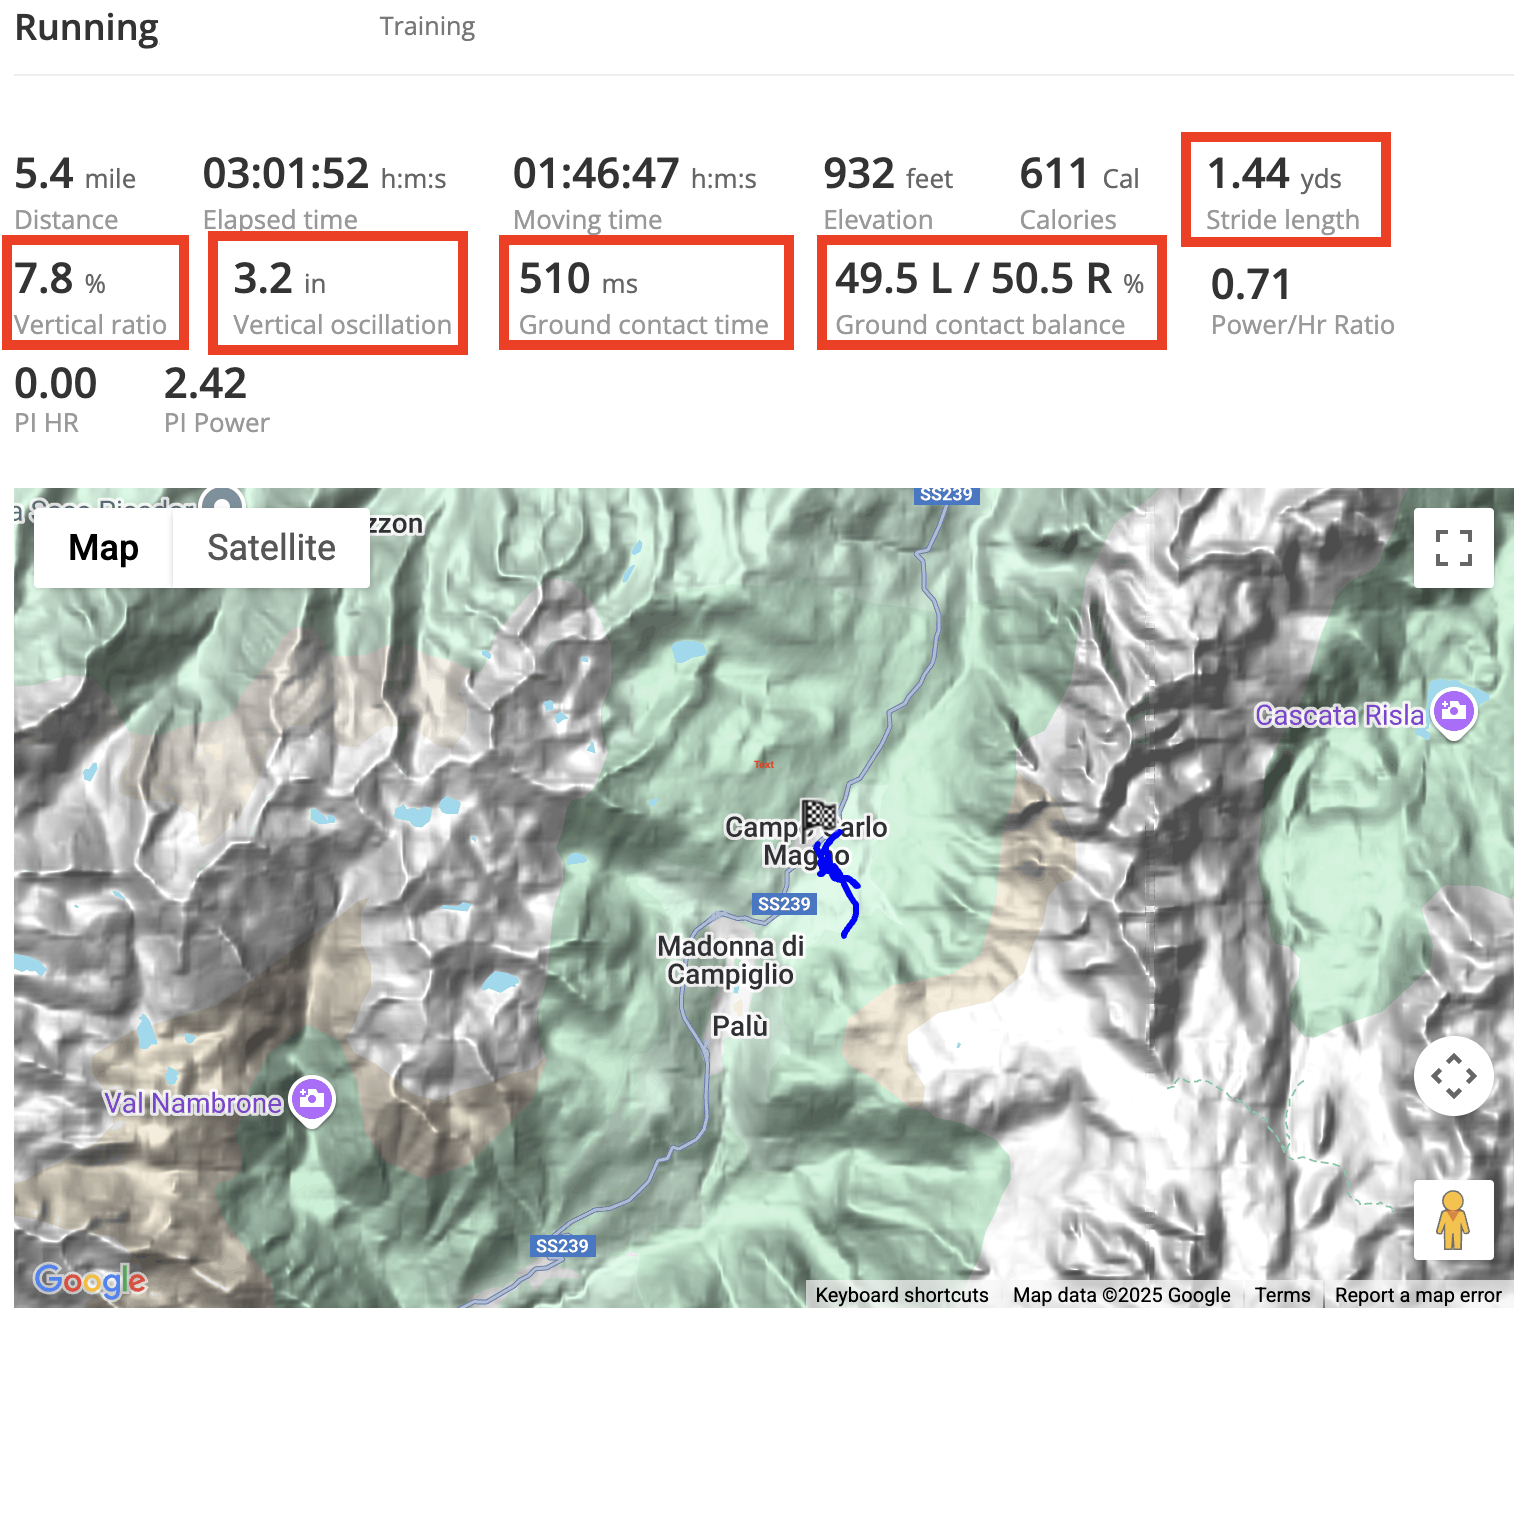
1. Step Length

Definition: The distance covered per step while running.

  • What It Tells You: A longer step length can indicate efficient propulsion, while a short step length might suggest inefficiencies or muscular limitations.
  • How It Helps: Monitoring this metric helps optimize stride mechanics, preventing overstriding (which increases injury risk) or understriding (which reduces speed).
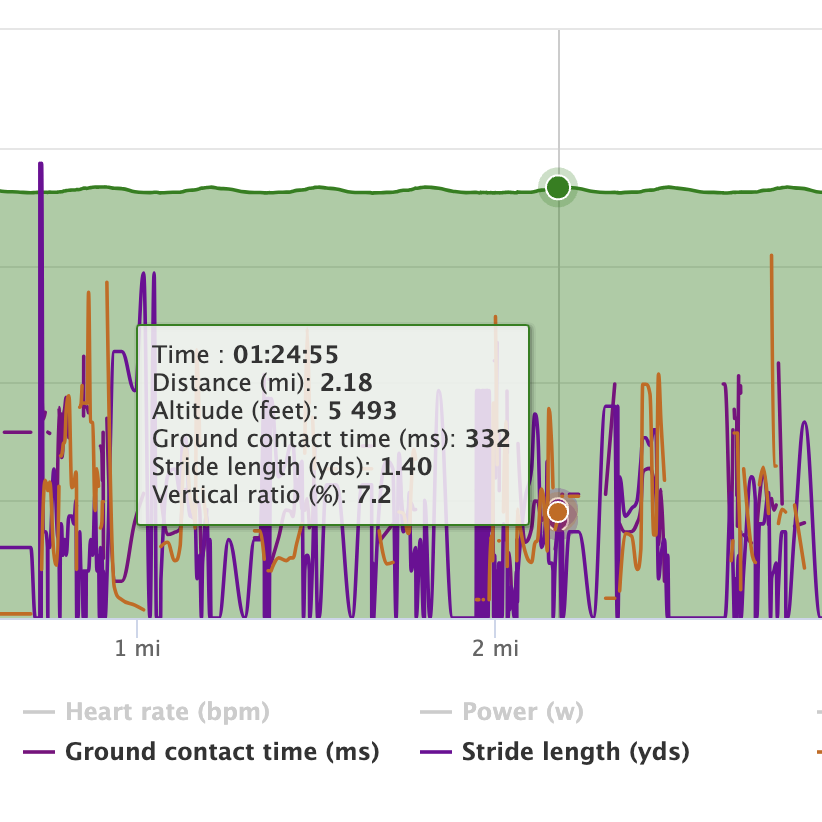
  • SELFLOOPS Features: Displays average step length and a detailed chart to track variations during a run.

2. Vertical Ratio

Definition: The ratio of vertical oscillation (up-and-down movement) to step length.

  • What It Tells You: A lower vertical ratio means more energy is being used for forward motion rather than wasted in vertical movement.
  • How It Helps: Reducing unnecessary vertical movement can improve running economy and efficiency.
  • SELFLOOPS Features: Calculates the average vertical ratio and presents a chart for visual analysis.

3. Vertical Oscillation

Definition: The amount of vertical movement (bounce) in each stride, measured in centimeters.

  • What It Tells You: Too much vertical oscillation means excessive energy is being lost in upward movement instead of propelling forward.
  • How It Helps: Coaches and runners can adjust stride mechanics and muscle engagement to reduce unnecessary bounce, leading to more efficient running.
  • SELFLOOPS Features: Displays average vertical oscillation for post-run analysis.

4. Ground Contact Time (GCT)

Definition: The time (in milliseconds) that a runner’s foot spends in contact with the ground per step.

  • What It Tells You: Shorter ground contact time is generally associated with more efficient, explosive strides, while longer contact time can indicate inefficient mechanics or fatigue.
  • How It Helps: Reducing ground contact time can improve cadence and running efficiency, making each stride more powerful.
  • SELFLOOPS Features: Provides average ground contact time and a chart to visualize fluctuations.

5. Ground Contact Time Balance

Definition: The percentage of ground contact time distributed between the left and right foot.

  • What It Tells You: A significant imbalance may indicate muscle weakness, injury risk, or biomechanical inefficiencies.
  • How It Helps: Ensuring an even balance helps prevent injuries and improve symmetry in running form.
  • SELFLOOPS Features: Calculates the percentage balance between the left and right foot to detect asymmetries.

How Coaches & Athletes Benefit from These Metrics

  1. Identify Inefficiencies – By tracking these key metrics, athletes can pinpoint weaknesses in their running form.
  2. Prevent Injuries – Imbalances in ground contact time and excessive vertical oscillation can increase injury risk. Early detection allows for corrective action.
  3. Optimize Performance – Fine-tuning step length, ground contact time, and vertical movement leads to more energy-efficient running.
  4. Personalized Coaching – Coaches can use these data points to design customized training plans and provide real-time feedback for improvements.

Start Analyzing Your Running Metrics Today!

SELFLOOPS is dedicated to bringing advanced performance-tracking tools to athletes and coaches worldwide. With the new Running Metrics, you can gain deeper insights into your running mechanics and make data-driven improvements.

Ready to elevate your running efficiency? Log into your SELFLOOPS account and start analyzing your runs today!

Stay strong, run smart, and train with precision.

Announcing Advanced Cycling Analytics Metrics on SELFLOOPS: Elevate Your Performance with Cutting-Edge Insights

At SELFLOOPS, we are committed to empowering athletes and coaches with the most advanced tools to analyze, optimize, and elevate sports performance.

Today, we are thrilled to announce a significant step forward in our mission: the introduction of Cycling Dynamics Metrics for cyclists using a bike power meter. These new metrics are designed to provide deeper insights into your cycling performance, helping you leave nothing to chance as you focus on science, physiology, and data-driven improvement.

Cycling is no longer just about power output and speed. With the latest advancements in technology, we can now dive into the finer details of your pedal stroke, balance, and efficiency. These new metrics are a game-changer for cyclists looking to refine their technique, optimize their training, and ultimately perform at their best.

Introducing the New Cycling Dynamics Metrics

Here’s a breakdown of the new metrics now available on the SELFLOOPS platform:

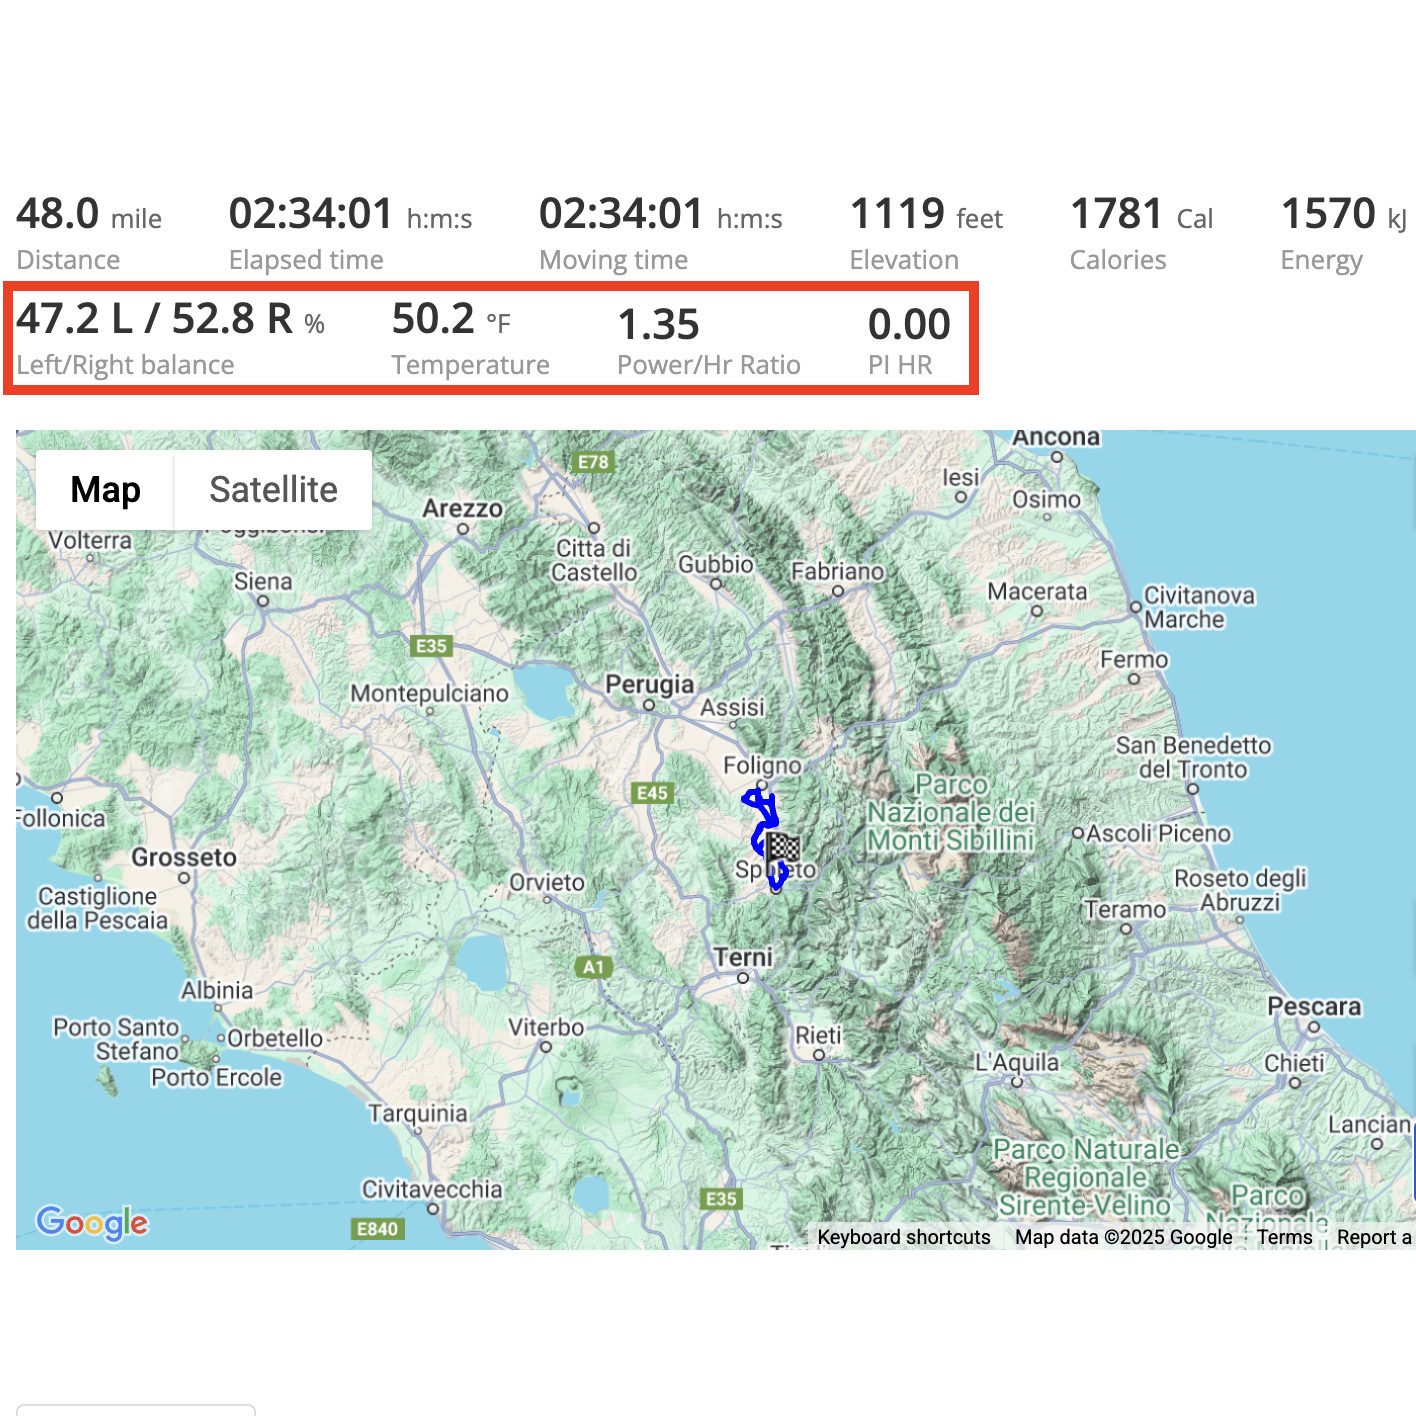
1) Left/Right Balance (Average L/R)

This metric shows the distribution of power between your left and right legs during a ride. Ideally, cyclists aim for a 50/50 balance, but imbalances are common and can lead to inefficiencies or even injuries. By tracking your Left/Right Balance, you can identify asymmetries and work on correcting them through targeted training.

2) Pedal Smoothness (Average L/R)

Pedal Smoothness measures how evenly you apply force throughout your pedal stroke. A smoother pedal stroke is more efficient and reduces wasted energy. This metric helps you understand your pedaling technique and identify areas where you can improve your efficiency, especially during high-intensity efforts.

3) Torque Effectiveness (Average L/R)

Torque Effectiveness evaluates how effectively you are using your power during the downstroke phase of your pedal stroke. It compares the useful force applied to the total force generated. A higher Torque Effectiveness score means you’re making the most of your energy output, which is critical for endurance and performance.

4) CP, W’ (Settings), W’Balance (Chart)

  • CP (Critical Power): This is the highest power output you can sustain for a prolonged period. It’s a key metric for understanding your aerobic capacity and setting training zones.
  • W’ (Anaerobic Work Capacity): This represents your ability to perform high-intensity efforts above your CP. It’s a measure of your anaerobic reserves.
  • W’Balance (Chart): This dynamic chart shows how much of your W’ you’ve used during a ride and how it recovers over time. It’s an invaluable tool for pacing during races or hard efforts, ensuring you don’t burn out too soon.

Why These Metrics Matter

Cycling is a sport of precision, and these metrics provide the granularity needed to fine-tune every aspect of your performance. Whether you’re a professional cyclist or a dedicated amateur, understanding your Left/Right Balance, Pedal Smoothness, Torque Effectiveness, and anaerobic capacity can help you:

  • Identify inefficiencies in your pedal stroke and correct them.
  • Optimize your training by focusing on specific weaknesses.
  • Pace yourself better during races or long rides using W’Balance.
  • Prevent injuries by addressing imbalances and asymmetries.

Innovation at the Heart of SELFLOOPS

At SELFLOOPS, we believe that performance improvement is rooted in science, data, and innovation. These new Cycling Dynamics Metrics are a testament to our commitment to providing athletes and coaches with the most advanced tools available. By integrating these metrics into our platform, we are setting a new standard for cycling analytics, enabling you to train smarter, perform better, and achieve your goals with confidence.

Conclusion

The introduction of Cycling Dynamics Metrics on the SELFLOOPS platform marks a significant leap forward in cycling performance analysis. These metrics go beyond traditional power and speed data, offering unparalleled insights into your technique, efficiency, and physiological capabilities. With SELFLOOPS, you’re not just tracking your performance—you’re mastering it.

Ready to take your cycling to the next level? Log in to SELFLOOPS today and explore the new metrics that are set to transform the way you train, race, and perform.

Leave nothing to chance. Embrace the science of performance with SELFLOOPS.


Stay tuned for more updates as we continue to innovate and bring you the tools you need to succeed. Ride strong, ride smart, and let SELFLOOPS guide your journey to greatness.

Unlocking Deeper Insights for Cyclists: Introducing W’ (W-prime), CP (Critical Power), and W’bal Analysis on SELFLOOPS

Cycling performance analysis has evolved significantly over the years, and understanding the physiological demands of training and racing is key to optimizing performance. At SELFLOOPS, we’re excited to announce the integration of advanced performance metrics—W’ (W-prime), Critical Power (CP), and W’bal (W’ balance)—into our platform. These concepts, pioneered by Dr. Skiba and widely adopted in endurance sports, provide a deeper understanding of an athlete’s capabilities and fatigue dynamics. Let’s break down what these terms mean and how they can revolutionize your training analysis.


What Are W’ (W-prime), CP (Critical Power), and W’bal?

  1. Critical Power (CP):
    Critical Power represents the highest power output an athlete can sustain for a prolonged period without fatiguing. Think of it as your “threshold” power—the point where your body balances energy production and fatigue. Above CP, fatigue accumulates rapidly; below it, you can sustain effort for much longer. CP is a cornerstone metric for cyclists, helping to define training zones and set pacing strategies.
  2. W’ (W-prime):
    W’ (pronounced “W-prime”) is often referred to as your “anaerobic work capacity” or “energy matchbox.” It represents the amount of work you can perform above your Critical Power before exhaustion sets in. Imagine it as a finite battery that depletes when you push above your CP and replenishes when you drop below it. W’ is crucial for understanding how much high-intensity effort you can sustain during sprints, climbs, or surges in a race.
  3. W’bal (W’ balance):
    W’bal is the real-time tracking of your W’ depletion and replenishment during a ride. It’s like monitoring your “battery level” as you train or race. When you push above CP, your W’ depletes; when you recover below CP, your W’ recharges. By visualizing W’bal, athletes and coaches can better understand how efforts and recoveries impact performance over time.

Selfloops Brings W’, CP, and W’bal to Your Fingertips

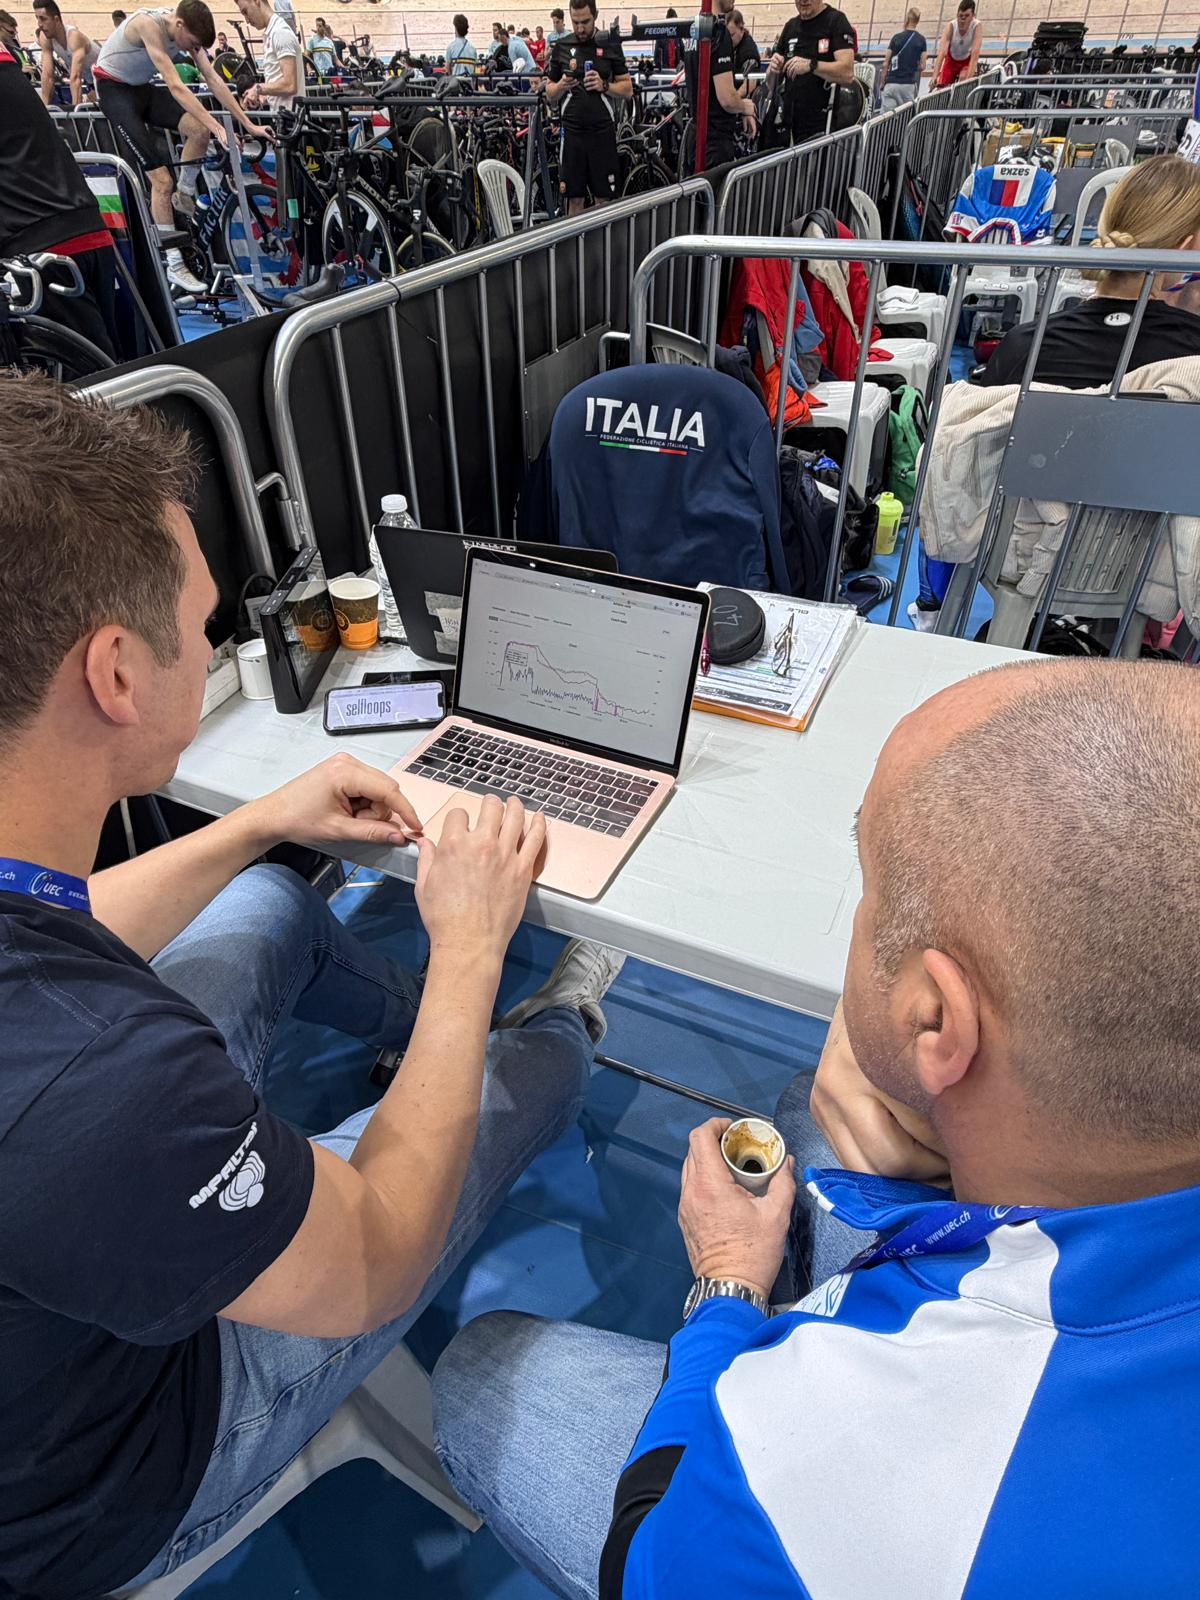
At Selfloops, we’re committed to providing athletes and coaches with the most advanced tools for performance analysis. That’s why we’ve integrated W’, CP, and W’bal into our platform. Now, users can input their Critical Power and W’ values in the Settings section under Zones, and our system will automatically generate a W’bal line chart for every activity with bike power data.

This feature allows you to visualize how your “battery” depletes and replenishes during a ride, giving you actionable insights into your pacing, recovery, and overall performance. Whether you’re analyzing a hard interval session, a long endurance ride, or a race simulation, W’bal provides a clear picture of your fatigue dynamics.


The Benefits of W’bal Analysis for Selfloops Users

  1. Optimized Pacing Strategies:
    By understanding your W’ depletion and replenishment, you can pace your efforts more effectively during races and training sessions. Avoid burning out too early or leaving energy unused at the finish line.
  2. Personalized Training Plans:
    Coaches can use W’bal data to tailor workouts that match an athlete’s unique physiology. For example, designing intervals that maximize W’ depletion or recovery periods that optimize W’ replenishment.
  3. Enhanced Recovery Insights:
    W’bal charts show how quickly you recover after intense efforts. This helps athletes and coaches identify whether recovery periods are sufficient or need adjustment.
  4. Race Simulation and Strategy Development:
    Simulate race scenarios and analyze how different pacing strategies impact your W’bal. This prepares you to make smarter decisions during actual competitions.
  5. Improved Fatigue Management:
    By tracking W’bal over time, you can identify patterns of fatigue accumulation and adjust your training load to prevent overtraining.
  6. Data-Driven Coaching:
    Coaches can use W’bal analysis to provide evidence-based feedback, helping athletes understand the physiological impact of their efforts and recoveries.

Why This Matters for Cyclists

Cycling is a sport of precision, where small adjustments in pacing and effort management can make a huge difference in performance. With W’, CP, and W’bal analysis, Selfloops users now have access to cutting-edge tools that were once reserved for elite athletes and sports scientists. Whether you’re a competitive cyclist, a coach, or a fitness enthusiast, these metrics empower you to train smarter, race harder, and recover better.


Get Started with W’bal Analysis on Selfloops

Ready to take your cycling performance to the next level? Log in to SELFLOOPS, head to the Settings section, and input your Critical Power and W’ values. Then, dive into your activity analysis to see your W’bal in action.

At SELFLOOPS, we’re proud to bring you the latest in sports science innovation. With W’, CP, and W’bal, you’re not just tracking your power—you’re unlocking the secrets to your performance potential.

Ride smarter, recover better, and achieve more with Selfloops.


Stay tuned for more updates as we continue to enhance your training and racing experience with cutting-edge features!