See what it means riding Giro d’Italia!
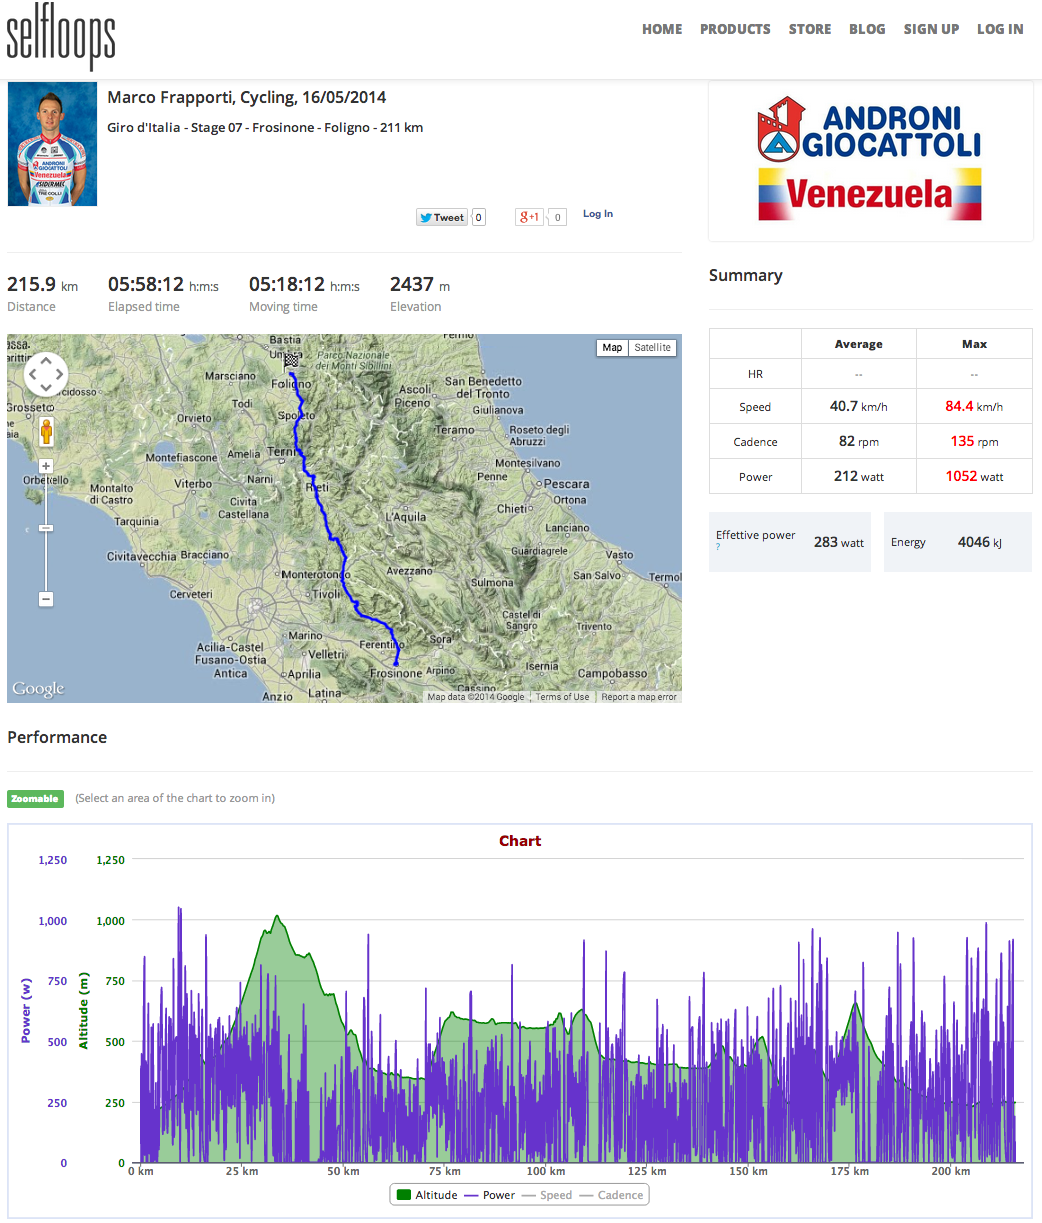
Marco Frapporti of Androni team has shared his stage 7 ride on SelfLoops.
Stage analysis with Androni sport director Giovanni Ellena and coach Fabrizio Tacchino.
Stage 7, Frosinone – Foligno, 211km May 16.
Click here to see the full analysis.