With the Selfloops platform, we offer an easy way to keep track of your fitness and sport activities intensity level.
You can select, for example, the Selfloops Trends feature and visualize how your TRIMP changes over time. The TRIMP score measures your activity intensity taking into account the heart rate data and the time spent while exercising. This is an easy and immediate way to see how hard you have worked during the year.
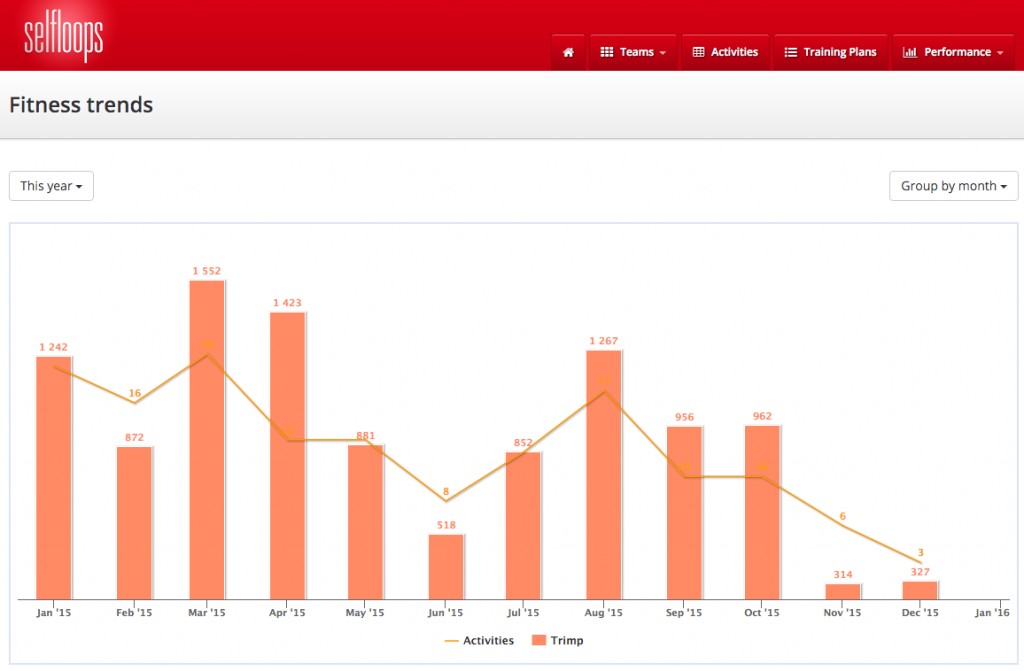
In the picture below the bar chart shows your accumulated TRIMP score for each month, and the line chart shows the number of the activities performed in that month.
If you use a bike power meter, instead of the TRIMP score, you can use the Training Load, that measures the activity intensity using the bike power (Watts) and the time spent while riding.
Any way, Selfloops Trends allows you to easily keep track of your efforts at glance.