La Gazzetta dello Sport, one of the main Italian sport newspapers, talks about the Selfloops Telemetry and the Italian National team (26 April 2014).
You can improve only what you measure
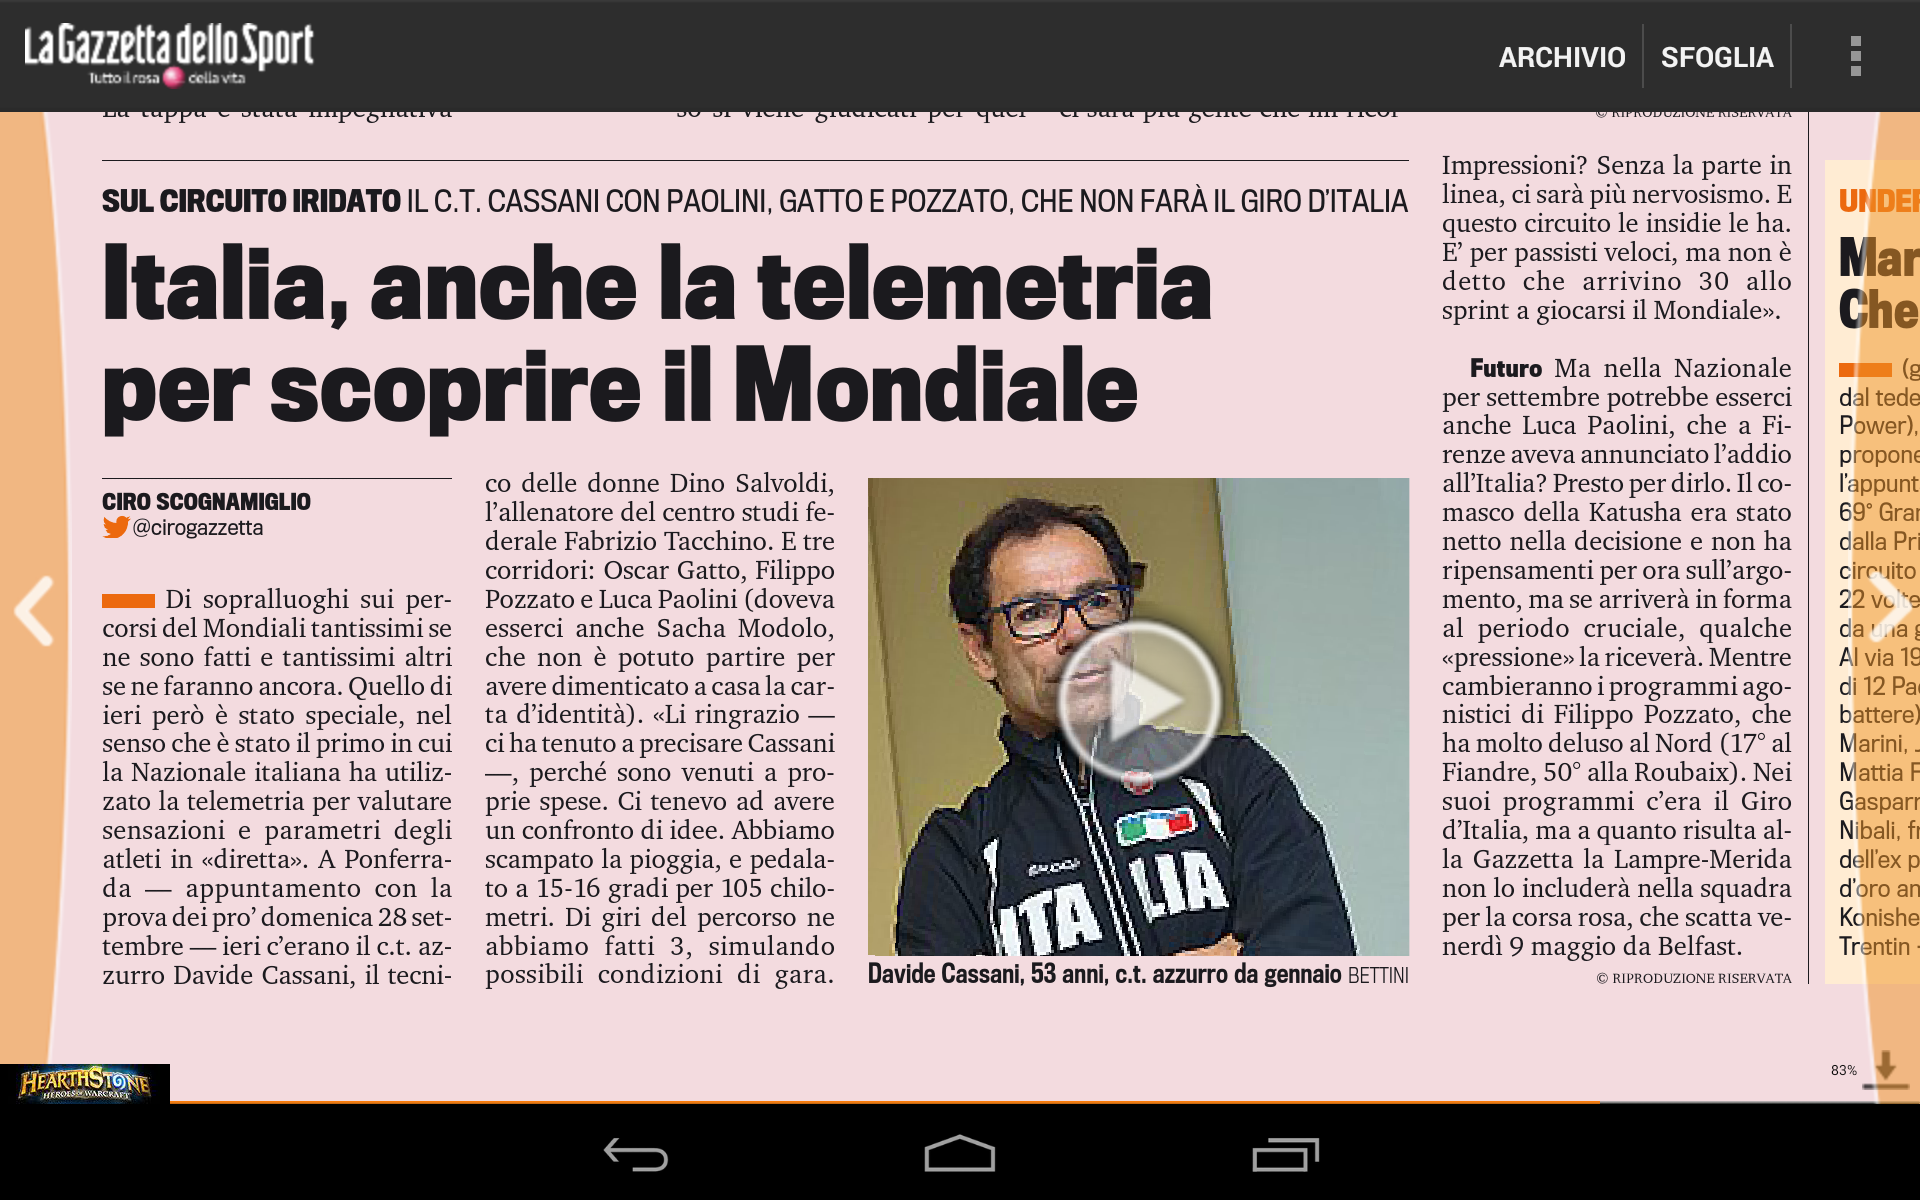
La Gazzetta dello Sport, one of the main Italian sport newspapers, talks about the Selfloops Telemetry and the Italian National team (26 April 2014).
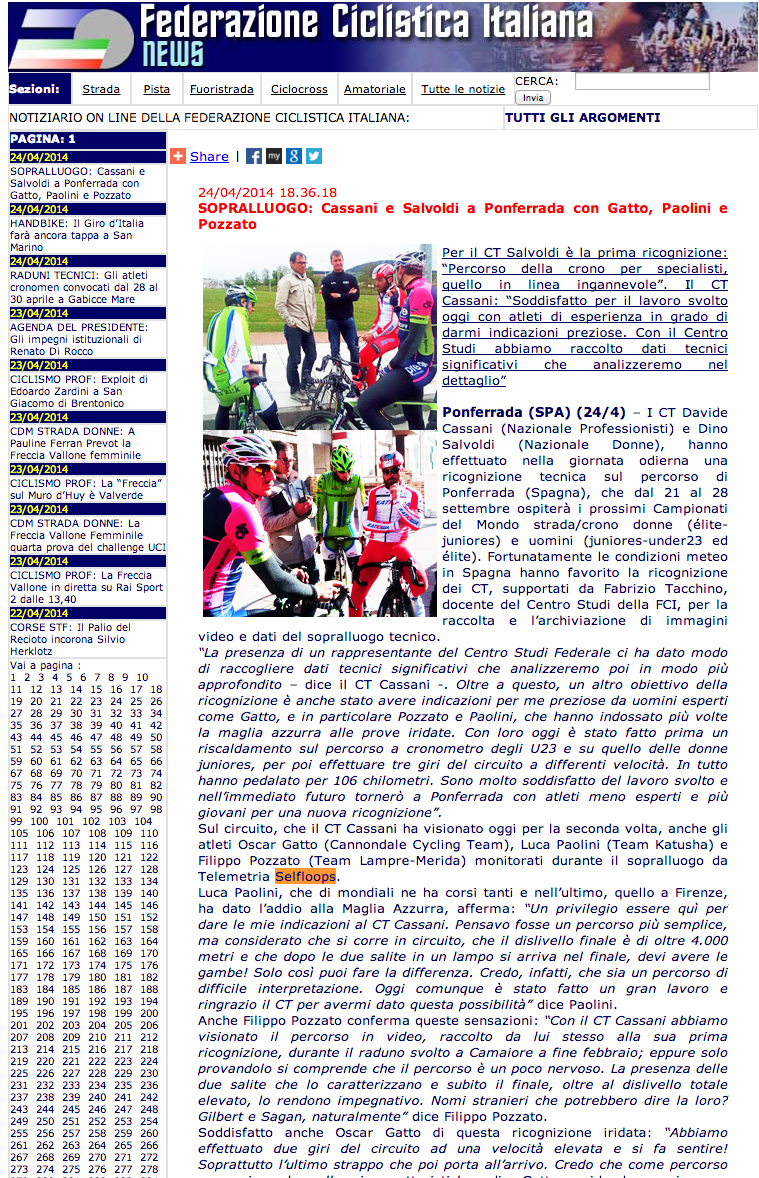
The Italian Cycling Federation is preparing for the World Cycling Championships in Spain and it is using the SelfLoops telemetry to get insights on the challenges of the competition.
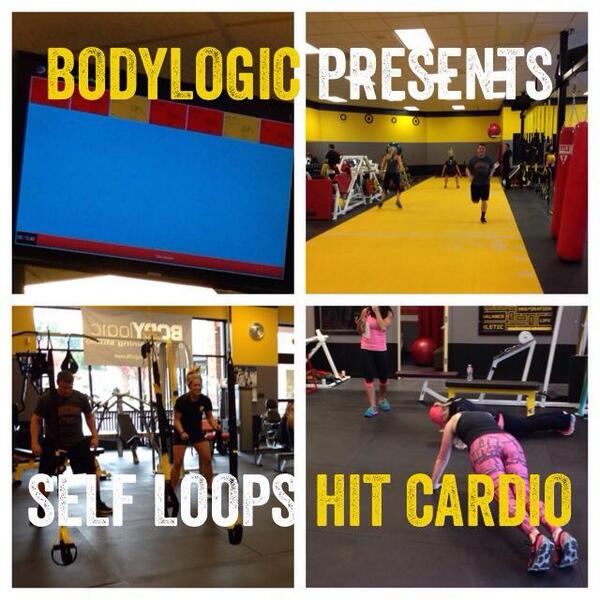
With the SelfLoops Group Fitness service you can track group cardio training sessions using an Android device. Now you can also stream your sessions wirelessly to TVs and projectors using Miracast™, a technology supported on Android 4.2 and higher.
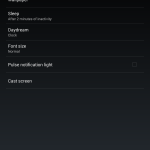
The Nexus 4, Nexus 5, Nexus 7 (2013), Nexus 10, and several other Android devices support the Wi-Fi Certified Miracast™ protocol for wireless display. To turn on the wireless display feature, go to Settings > Device > Display > Cast screen > Menu, then check the box next to “Enable Wireless Display.”
Many new TVs and projectors are Miracast enabled, or you can just plug a Miracast dongle on the TV HDMI port.

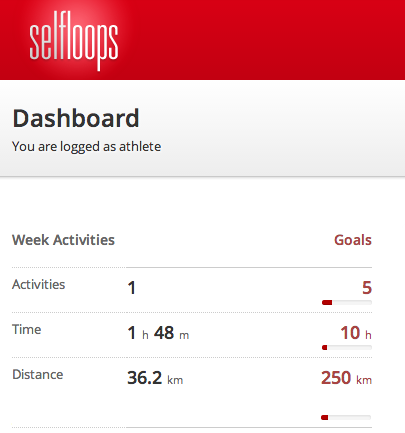
You can only improve what you measure. And you need to set goals and be able to track your progresses.
We have added the ability to set your weekly goals and track them. You can set your objectives in terms of number of activities, hours spent or distance. We believe we have added an important tools for people that are serious about their trainings.
If you have not done it yet, sign up to our SelfLoops website.