As wearable technology becomes increasingly common in the fitness industry, gyms and fitness clubs are facing an important operational question: should members be required to use a specific heart rate device, or should the platform adapt to the devices members already own?
For many facilities, flexibility and ease of onboarding are becoming key factors in member adoption and long-term engagement.
Supporting the Devices Members Already Use
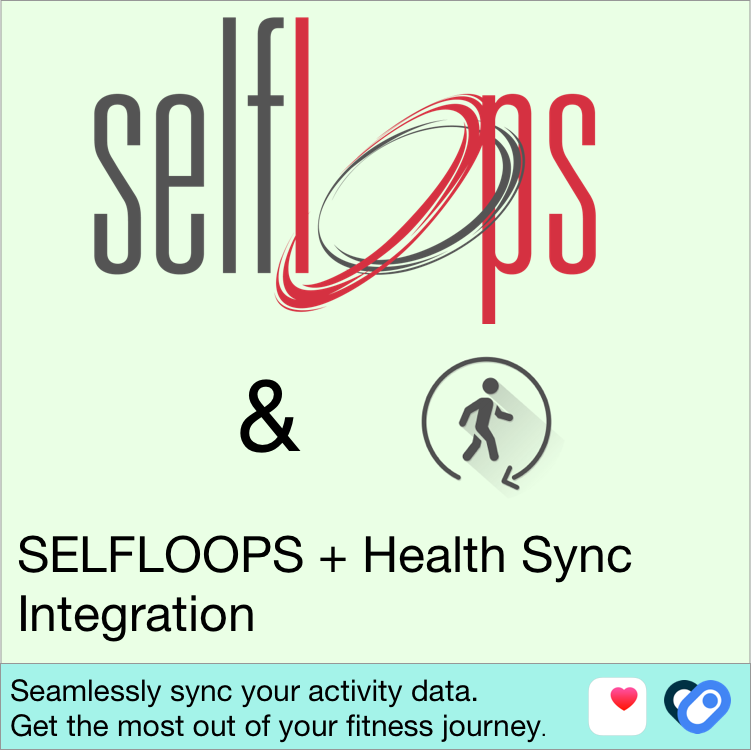
SELFLOOPS Group Fitness is a group heart rate tracking service designed to support a wide range of wearable devices and heart rate technologies, allowing members to participate using equipment they are already familiar with.
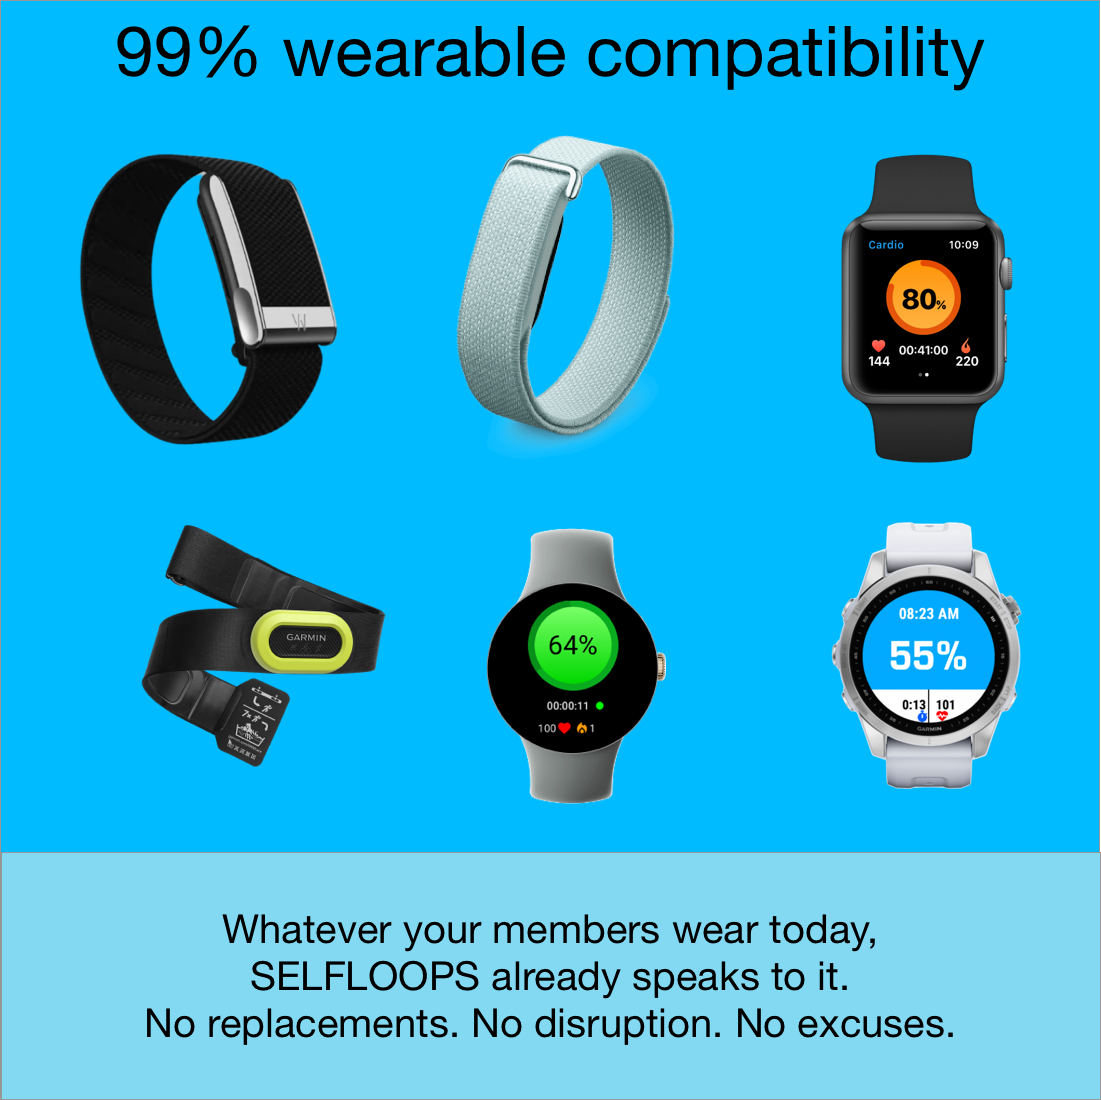
The platform currently supports:
- Whoop
- Google Fitbit Air
- Apple Watch
- Wear OS
- ANT+ heart rate devices, including products from brands such as Garmin, Polar, and Wahoo Fitness and many others.
This broad compatibility reduces friction during onboarding and eliminates the need for members to purchase additional hardware before participating in group fitness classes.
Reducing Operational Friction for Clubs and Franchises
For gyms operating at scale, compatibility can significantly impact both member experience and operational efficiency.
When members can connect devices they already own:
- Setup time is reduced
- Staff support requirements decrease
- Adoption rates typically improve
- Barriers to participation are minimized
This flexibility is particularly valuable for multi-location gyms and fitness franchises, where simplifying onboarding processes can have a meaningful effect across hundreds or thousands of members.
Optional Branded Heart Rate Devices
While many clubs prefer a bring-your-own-device approach, some facilities also choose to offer branded heart rate monitors as part of their ecosystem.
Providing club-branded devices can help reinforce brand identity inside the facility while giving members an additional option for participation. It also creates a more unified in-club experience for facilities that want tighter control over hardware deployment.
A Flexible Approach to Group Fitness Technology
Rather than locking facilities into a single hardware ecosystem, SELFLOOPS takes a platform-first approach focused on interoperability and scalability.
By supporting a broad range of wearables and heart rate technologies, clubs can implement group fitness tracking without disrupting the habits and device preferences of their members.
The result is a more accessible and scalable experience for both operators and participants.