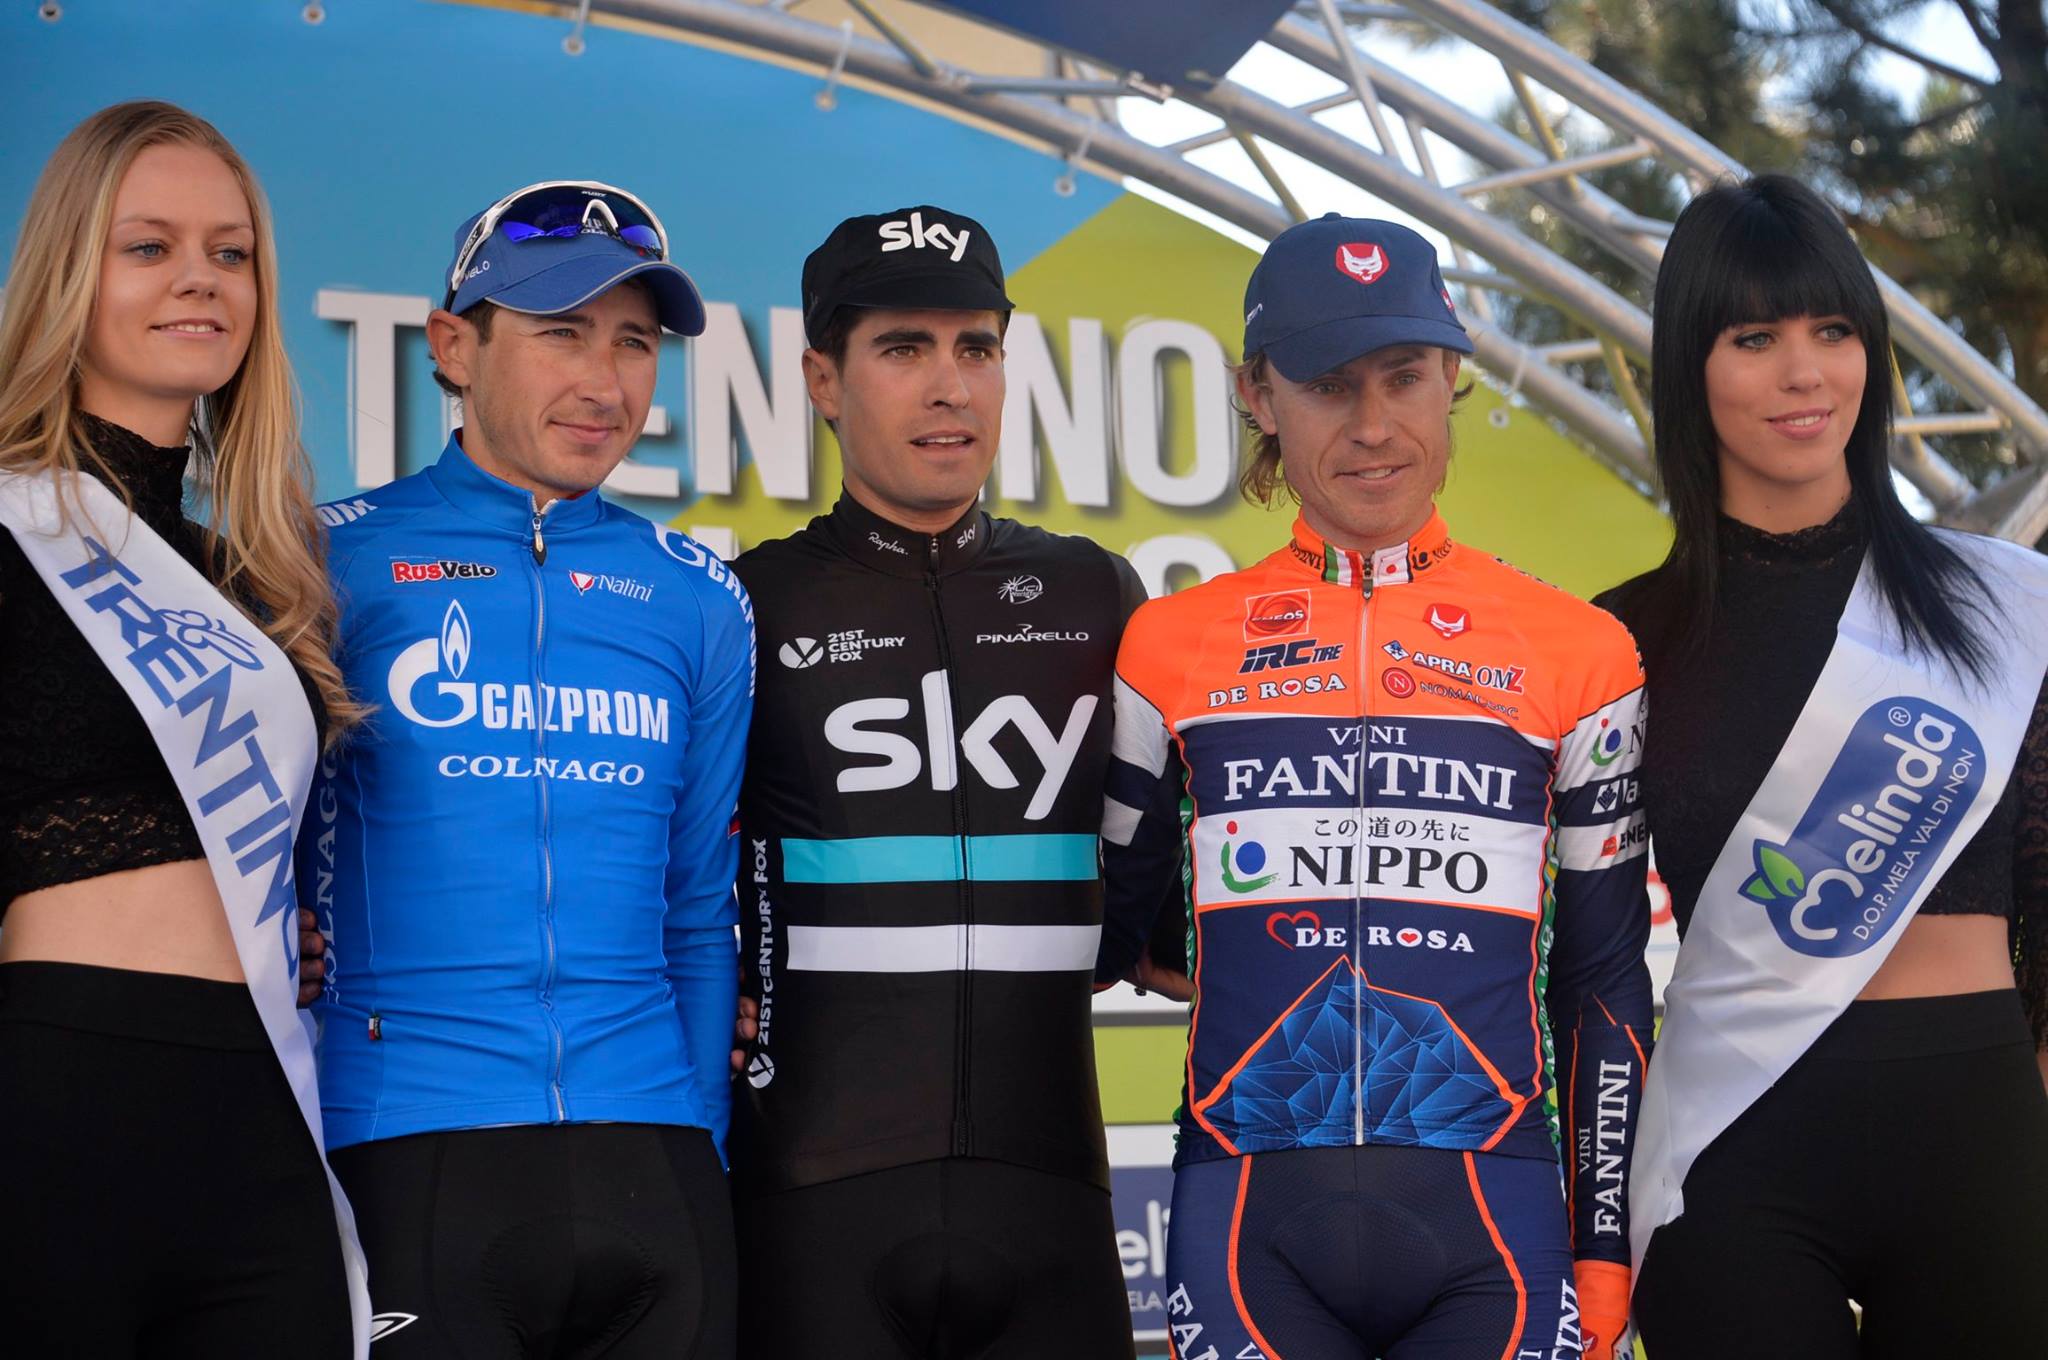
Giro del Trentino 2016, Stage 2. Two out of three of the riders in the podium use Selfloops to track and analyze sports performance! Congrats Nippo–Vini Fantini and Gazprom-RusVelo nice to see such photo! (photo credit Stefano Sirotti)
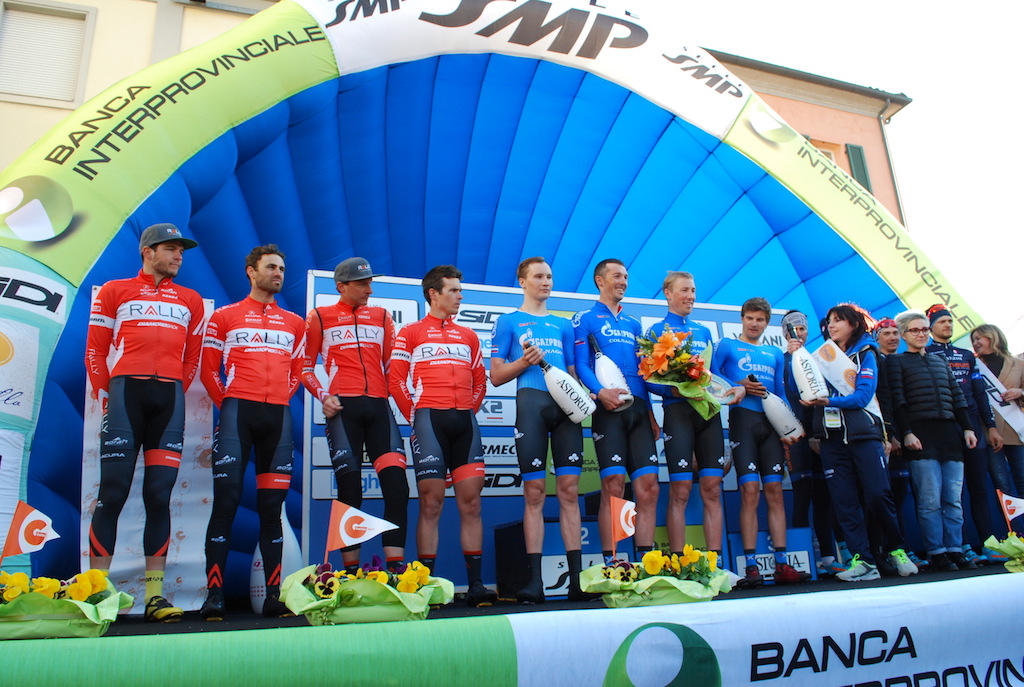
Settimana Internazionale Coppi e Bartali 2016, Stage 1b (TTT). Two of the teams in the podium use Selfloops! Well done Gazprom-RusVelo and Unieuro Wilier.
Category: Updates
Share your activities the way you want
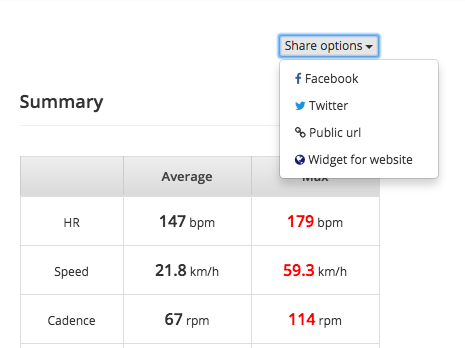
All your activities in Selfloops are visible only by you. However, we offer various ways to share some of your sessions.
You can share an activity on Facebook, Twitter, by email and in your blog or webpage. You choose, just select the Share option button.
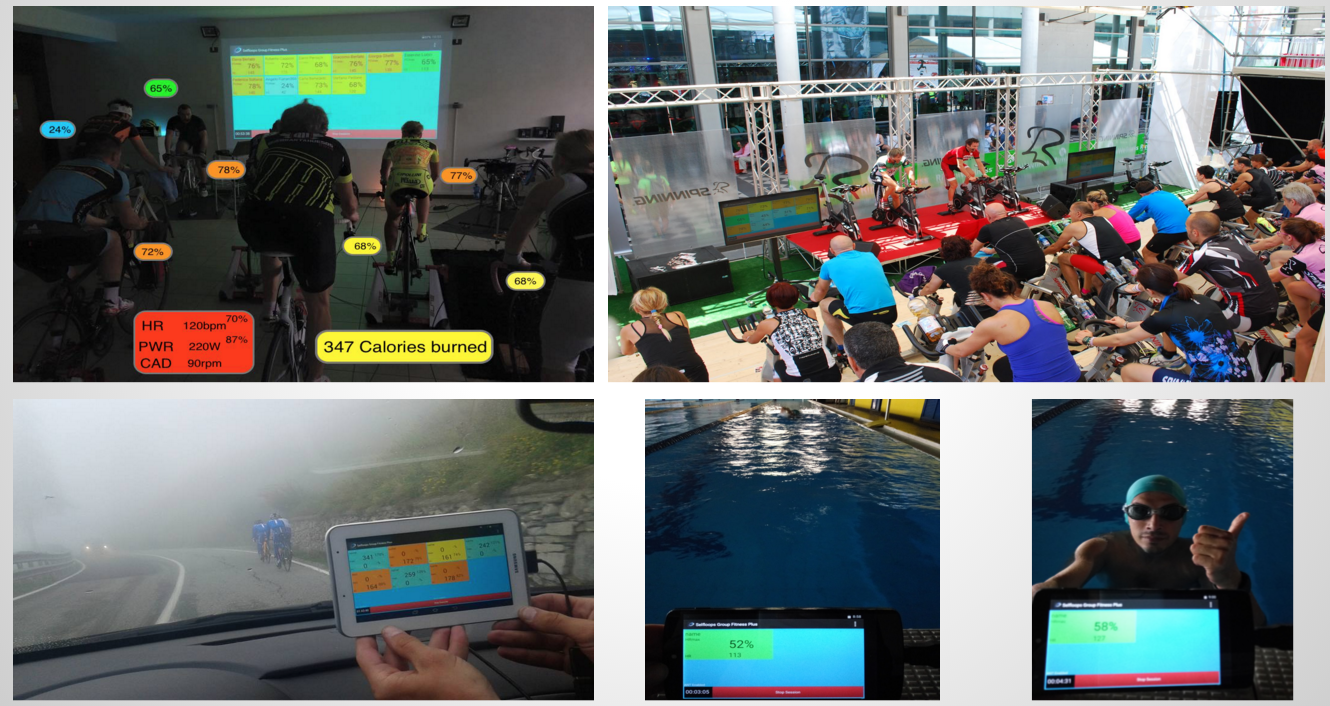
Tracking sport performance – No matter where you are
With our most advanced solution, the Group Fitness PRO, we can cover very large areas. Real-time data can be received from the athletes and statistics are available during the practice.
Data are recorded and they can be analyzed on the application. They can also be uploaded on the Selfloops website for an in-depth analysis.
The PRO version connects to heart rate monitors, bike power sensors, cadence sensors, rowers. We have tested the application on velodromes, athletics tracks and swimming pools.
Real-time analysis and feedback is key to improve performance. Post-analysis of the workouts complements the data driven approach to sport performance.
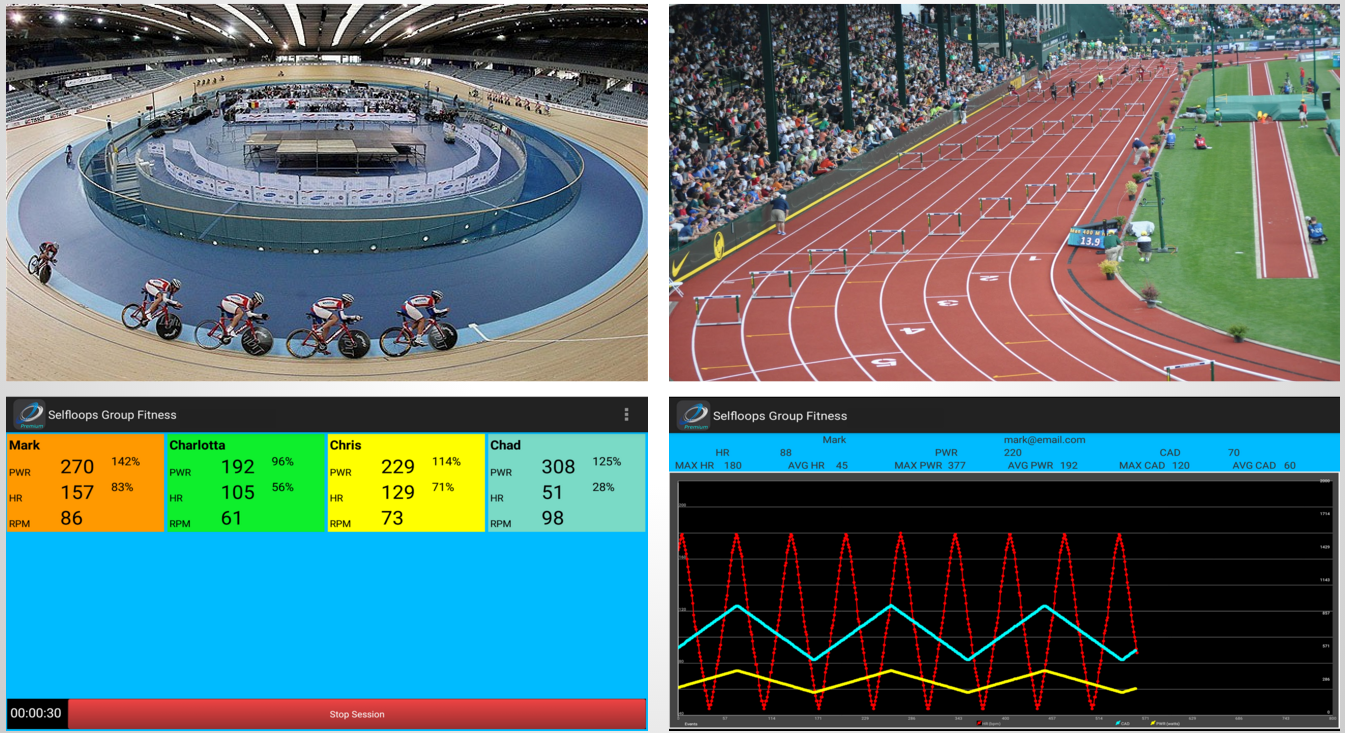
No matter where you are
Group Fitness Premium
Our Group Fitness Premium app is compatible with 198 different products, quite impressive! And It supports many different sensors: heart rate monitors, bike power sensors, rowers, skiErg, elliptical machines.
https://www.thisisant.com/directory/
If you like training with power in a group settings, this is the application for you.
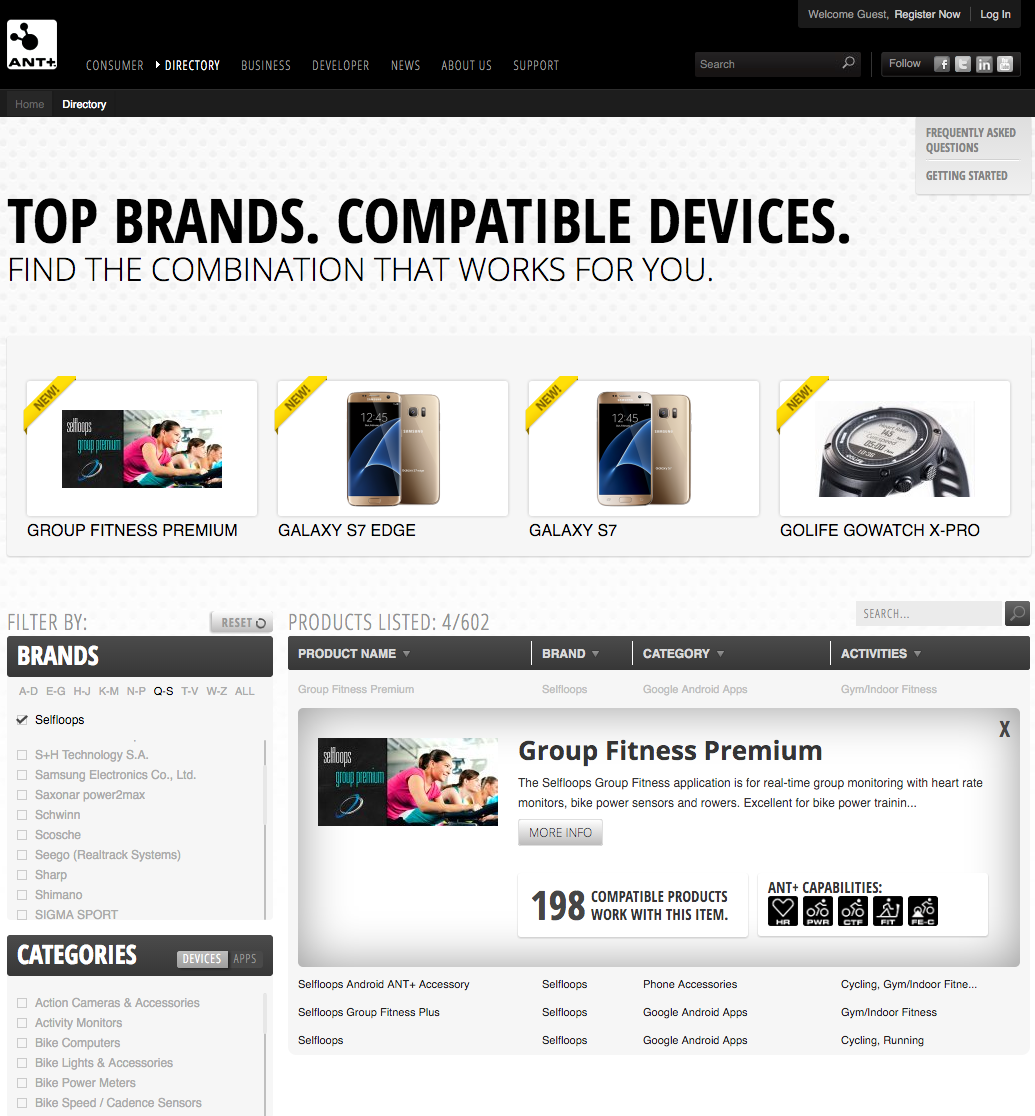
The application is certified by the ANT+ Alliance.
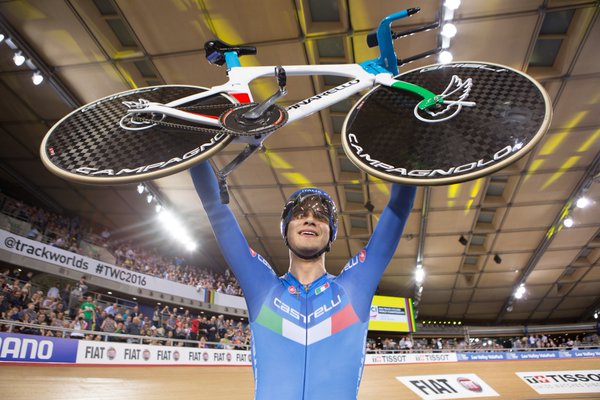
Gold medal winners use Selfloops
Gold medal winners use Selfloops! Bravo Filippo Ganna (and the Italian Cycling Federation staff).
It’s gold for the Italian in the men’s individual pursuit at the 2016 UCI Track Cycling World Championships in London 2-6 March, Lee Valley VeloPark.